
Lightrun Answers was designed to reduce the constant googling that comes with debugging 3rd party libraries. It collects links to all the places you might be looking at while hunting down a tough bug.
And, if you’re still stuck at the end, we’re happy to hop on a call to see how we can help out.
React Devtools perf issue with 16.7.0
See original GitHub issueDo you want to request a feature or report a bug? Bug
What is the current behavior? When using a component that creates new Date objects inside an interval while having the Devtools extension open, the performance are really slow.
With React 16.4.1, I don’t have the same issue so it might be related to the Profiler tab (even if it also happen when being on the Elements tab).
Reproduction: 16.7.0 version with performance issues: https://codesandbox.io/s/w6zrvx1y98 16.4.1 version without perf issues: https://codesandbox.io/s/4x4jmx8zx4
Open the devtools on the standalone page (https://w6zrvx1y98.codesandbox.io) while watching the Chrome task manager and you will see the memory go up quickly and the CPU be higher than 100%.
You might want to adjust the ARRAY_SIZE and INTERVAL constants based on your computer performance.
What is the expected behavior? The page should not slow down that much. In my app, I display a list of 30 lines where each of them contains this component and the refresh rate is one second (the time change there). There was no issue at all with React 16.4.1 (I actually didn’t know that this component existed 😄).
Which versions of React, and which browser / OS are affected by this issue? Did this work in previous versions of React? 16.7.0 is affected while 16.4.1. I also had the same issue with 16.6.0 and I thought it was related to #14365 but it is actually a different one.
[EDIT]: it’s not a Chrome issue because I could reproduce the same issue on Firefox.
By the way, I’d be happy to make a PR for this if this makes sense. 🙂
Issue Analytics
- State:

- Created 5 years ago
- Reactions:2
- Comments:18 (7 by maintainers)
 Top Related StackOverflow Question
 Troubleshoot Live Code
 Top Related Reddit Thread
 Top Related Hackernoon Post
 Top Related Tweet
 Top Related Dev.to Post
 Top Related Hashnode Post
I’ve just profile the example I’ve shared above and here are the results:
With React 16.4.1
With React 16.7.0 (same with 16.8.1)
As you can see, with 16.7, there is some big chunks of function calls in the devtools extension, especially this one: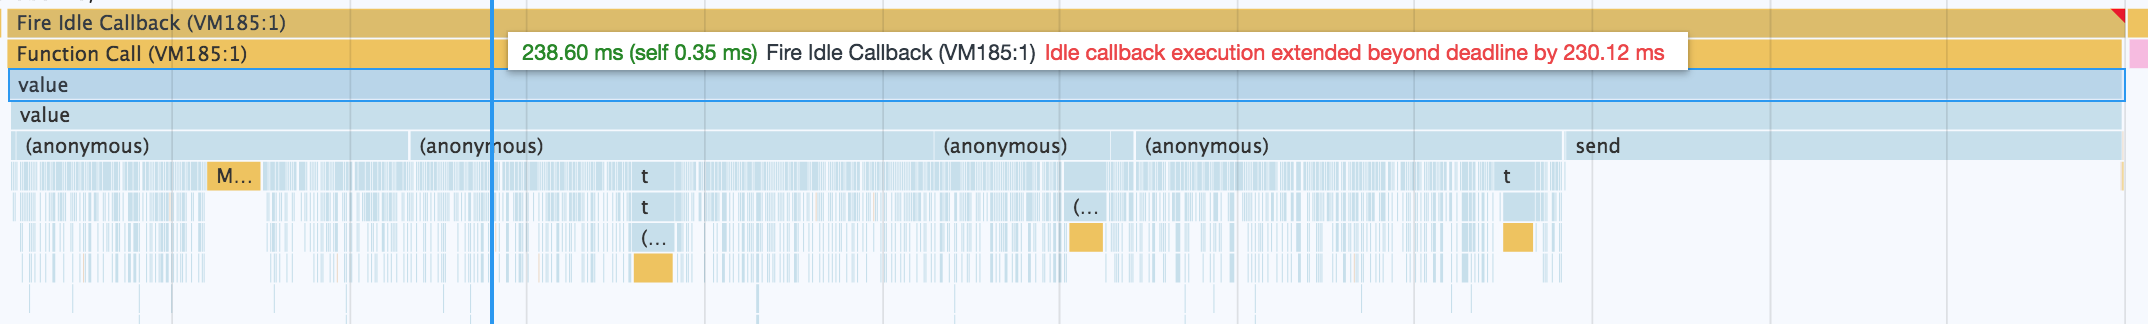
I’m installing the development version of Devtools so I can better understand what this function is doing.
I mean that while slowdown may be caused by the profiler mode (which is enabled when devtools is detected) it may still happen inside React. Look at https://github.com/facebook/react/issues/14365 for an example.