
Stuck on an issue?
Lightrun Answers was designed to reduce the constant googling that comes with debugging 3rd party libraries. It collects links to all the places you might be looking at while hunting down a tough bug.
And, if you’re still stuck at the end, we’re happy to hop on a call to see how we can help out.
D3: Create a Scatterplot with SVG Circles - Test is Passing But Should Fail
See original GitHub issueDescribe your problem and - if possible - how to reproduce it
Problem
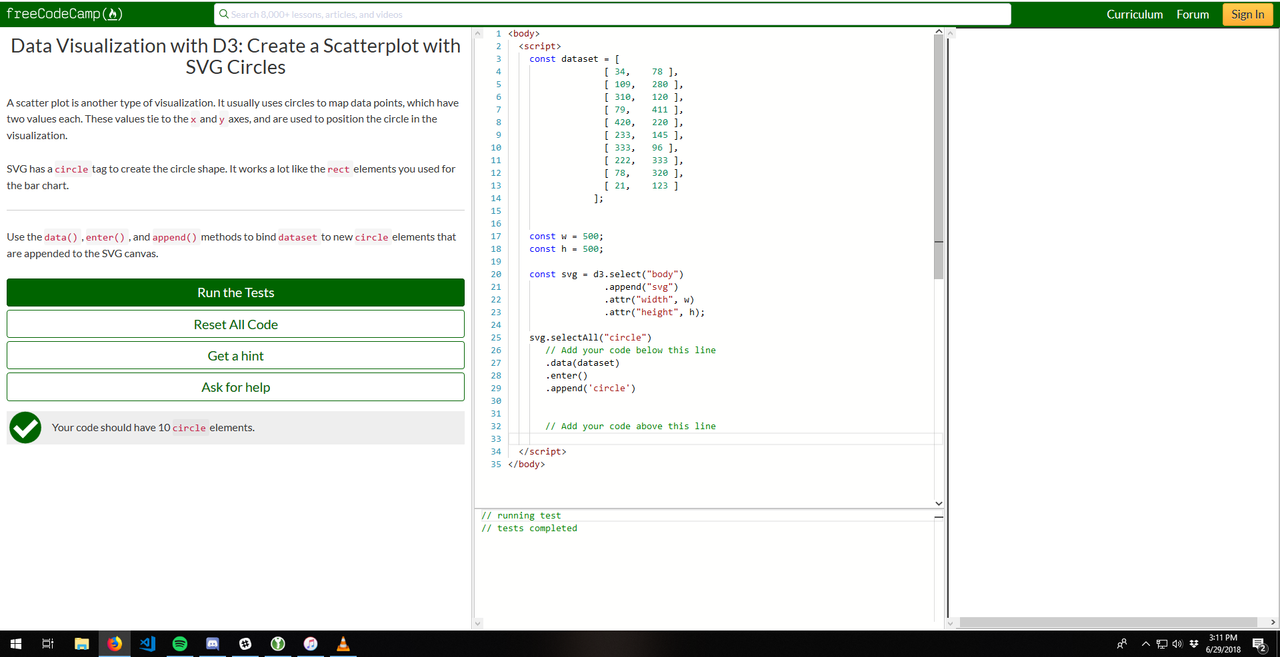
Test is passing but it should fail. Circles are not rendered.
Reproduce
Insert the code below to pass test:
// Add your code below this line
       .data(dataset)
       .enter()
       .append('circle')
// Add your code above this line
Add a Link to the page with the problem
Tell us about your browser and operating system
- Browser Name: Firefox
- Browser Version: 61.0 (64-bit)
- Operating System: Windows 10 Pro (64-bit)
If possible, add a screenshot here
Issue Analytics
- State:

- Created 5 years ago
- Comments:6 (6 by maintainers)
 Top Results From Across the Web
Create a Scatterplot with SVG Circles - Free Code Camp
In this data visualization with D3 tutorial we create a scatterplot with SVG circles. This video constitutes one part of many where I...
Read more >Add Labels to Scatter Plot Circles - Data Visualization with D3
In this data visualization with D3 tutorial we add labels to scatter plot circles. This video constitutes one part of many where I...
Read more >Changing radius of multiple points on D3 scatterplot based on ...
Currently, the radius of the circle will change when hovered over. I want to be able to have both circles for each case...
Read more >Introduction to D3, Part 2 / Jiayu Meng / Observable
Our envisioned design is a scatter plot of countries (circles) that we: Position along the x-axis by the number of children per mother...
Read more >Chapter 4. Chart components - D3.js in Action
But to get a better view of this data, we'll need to create a boxplot. Building a boxplot is similar to building a...
Read more > Top Related Medium Post
No results found
 Top Related StackOverflow Question
No results found
 Troubleshoot Live Code
Lightrun enables developers to add logs, metrics and snapshots to live code - no restarts or redeploys required.
Start Free Top Related Reddit Thread
No results found
 Top Related Hackernoon Post
No results found
 Top Related Tweet
No results found
 Top Related Dev.to Post
No results found
 Top Related Hashnode Post
No results found
@nischaldutt looks like no one has taken it up, so go right ahead!
@sdabhi23 methods issue has been resolved but the Note below the description has not been added, as suggested by @moT01