
Lightrun Answers was designed to reduce the constant googling that comes with debugging 3rd party libraries. It collects links to all the places you might be looking at while hunting down a tough bug.
And, if you’re still stuck at the end, we’re happy to hop on a call to see how we can help out.
BUG: Choropleth mapping seems scrambled with empty classes
See original GitHub issue-
I have checked that this issue has not already been reported.
-
I have confirmed this bug exists on the latest version of geopandas.
-
(optional) I have confirmed this bug exists on the master branch of geopandas.
Code Sample, a copy-pastable example
from pysal.lib import examples
import mapclassify
import geopandas
import matplotlib.pyplot as plt

mx_ex = examples.load_example('mexico')
mx = geopandas.read_file(mx_ex.get_file_list()[0])

years = ['PCGDP1940', 'PCGDP1960', 'PCGDP1980', 'PCGDP2000']
pooled = mapclassify.Pooled(mx[years])

f, axs = plt.subplots(2, 2, figsize=(12, 12))
axs = axs.flatten()
for i, y in enumerate(years):
    mx.plot(
        y,
        scheme='UserDefined',
        classification_kwds={
            'bins': pooled.global_classifier.bins
        },
        legend=True,
        ax=axs[i]
    )
    axs[i].set_axis_off()
    axs[i].set_title(y)
plt.tight_layout()
plt.show()
Problem description
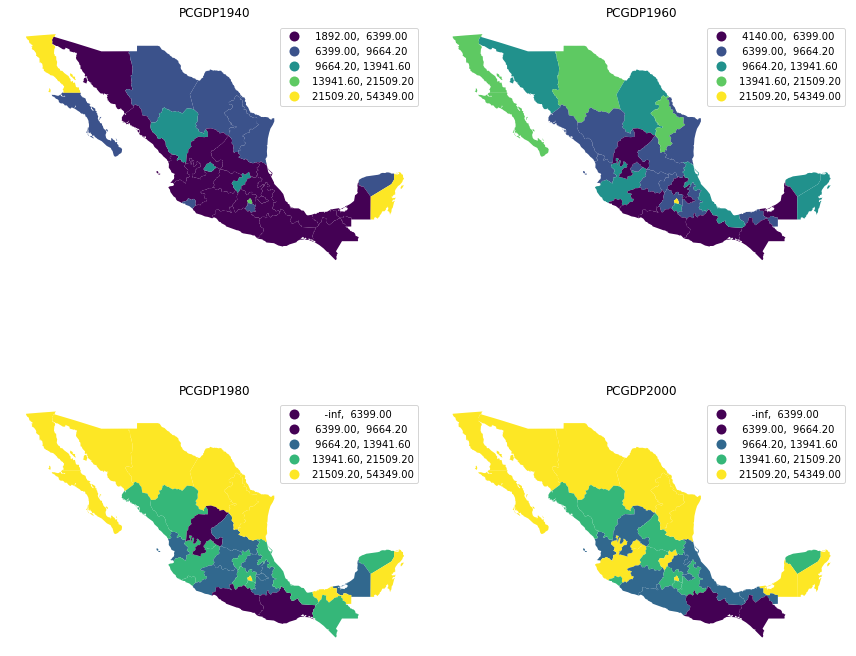
The current behaviour generates a scrambled ledend when there aren’t values in any of the categories. Ideally, the same legend and classification should appear with the UserDefined classifier whether there are values or not.
Expected Output
Uniform legend across the four maps. Instead, this is the figure created:
Output of geopandas.show_versions()
This is run on the gds_env:6.1, versions info below:
SYSTEM INFO
-----------
python     : 3.8.8 | packaged by conda-forge | (default, Feb 20 2021, 16:22:27)  [GCC 9.3.0]
executable : /opt/conda/bin/python
machine    : Linux-5.4.0-77-generic-x86_64-with-glibc2.10

GEOS, GDAL, PROJ INFO
---------------------
GEOS       : 3.9.1
GEOS lib   : /opt/conda/lib/libgeos_c.so
GDAL       : 3.2.1
GDAL data dir: /opt/conda/share/gdal
PROJ       : 7.2.0
PROJ data dir: /opt/conda/share/proj

PYTHON DEPENDENCIES
-------------------
geopandas  : 0.9.0
pandas     : 1.2.3
fiona      : 1.8.18
numpy      : 1.20.1
shapely    : 1.7.1
rtree      : 0.9.7
pyproj     : 3.0.1
matplotlib : 3.3.4
mapclassify: 2.4.2
geopy      : 2.1.0
psycopg2   : 2.8.6 (dt dec pq3 ext lo64)
geoalchemy2: 0.8.4
pyarrow    : 3.0.0
pygeos     : 0.9
Issue Analytics
- State:

- Created 2 years ago
- Comments:9 (7 by maintainers)
 Top Related StackOverflow Question
 Troubleshoot Live Code
 Top Related Reddit Thread
 Top Related Hackernoon Post
 Top Related Tweet
 Top Related Dev.to Post
 Top Related Hashnode Post
The colormap inconsistency should be fixed by #2019. The legend labels need to be handled separately.
I think a
minkeyword solves the Mexico example, but I don’t think it solves the case where the lowest 2 (or more) bins are empty; or multiple upper end bins are empty.