
Lightrun Answers was designed to reduce the constant googling that comes with debugging 3rd party libraries. It collects links to all the places you might be looking at while hunting down a tough bug.
And, if you’re still stuck at the end, we’re happy to hop on a call to see how we can help out.
Django channels + ASGI leaks memory
See original GitHub issueI expended around 3 days trying to figure out what was leaking in my Django app and I was only able to fix it by disabling sentry Django integration (on a very isolated test using memory profiler, tracemalloc and docker). To give more context before profiling information, that’s how my memory usage graph looked on a production server (killing the app and/or a worker after a certain threshold):
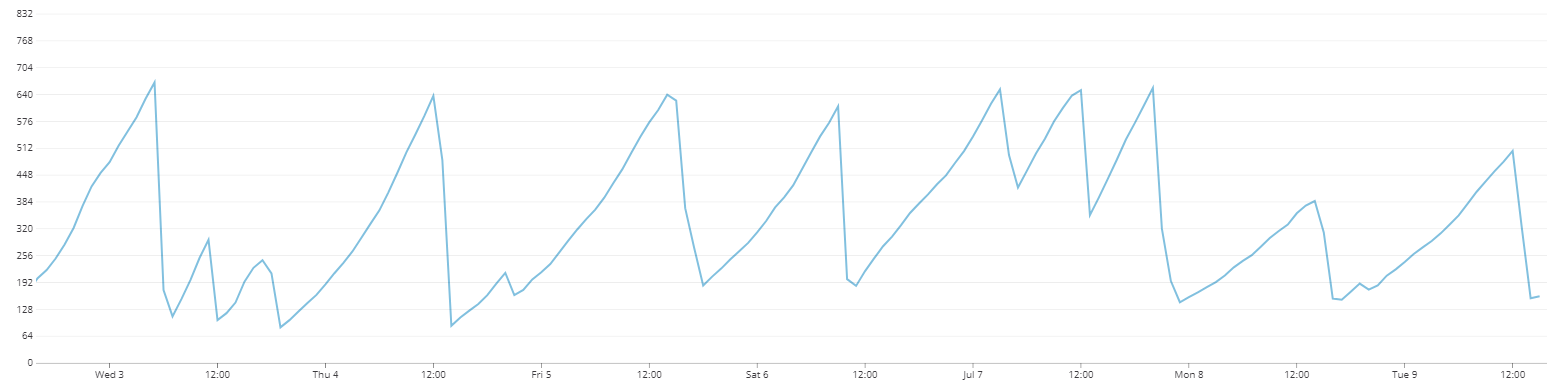
Now the data I gathered:
By performing 100,000 requests on this endpoint:
class SimpleView(APIView):
    def get(self, request):
        return Response(status=status.HTTP_204_NO_CONTENT)
A tracemalloc snapshot, grouped by filename, showed sentry django integration using 9MB of memory after a 217 seconds test with 459 requests per second. (using NGINX and Hypercorn with 3 workers):
/usr/local/lib/python3.7/site-packages/sentry_sdk/integrations/django/__init__.py:0: size=8845 KiB (+8845 KiB), count=102930 (+102930), average=88 B
/usr/local/lib/python3.7/site-packages/django/urls/resolvers.py:0: size=630 KiB (+630 KiB), count=5840 (+5840), average=110 B
/usr/local/lib/python3.7/linecache.py:0: size=503 KiB (+503 KiB), count=5311 (+5311), average=97 B
/usr/local/lib/python3.7/asyncio/selector_events.py:0: size=465 KiB (+465 KiB), count=6498 (+6498), average=73 B
/usr/local/lib/python3.7/site-packages/sentry_sdk/scope.py:0: size=325 KiB (+325 KiB), count=373 (+373), average=892 B
tracemalloc probe endpoint:
import tracemalloc
tracemalloc.start()

start = tracemalloc.take_snapshot()

@api_view(['GET'])
def PrintMemoryInformation(request):
    current = tracemalloc.take_snapshot()

    top_stats = current.compare_to(start, 'filename')
    for stat in top_stats[:5]:
        print(stat)

    return Response(status=status.HTTP_204_NO_CONTENT)
I have performed longers tests and the sentry django integration memory usage only grows, never releases, this is just a scaled-down version of the tests I’ve been performing to identify this leak.
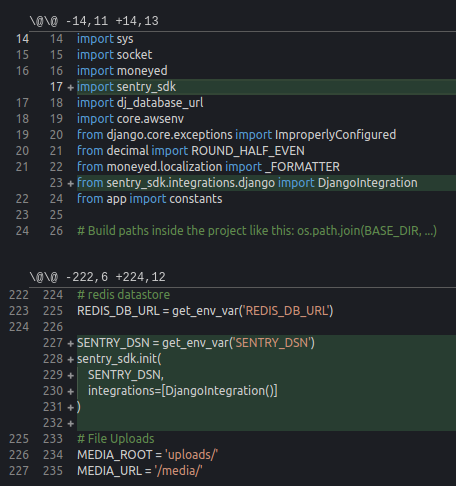
This is how my sentry settings looks like on settings.py:
Memory profile after disabling the Django Integration (same test and endpoint), no sentry sdk at top 5 most consuming files:
/usr/local/lib/python3.7/site-packages/django/urls/resolvers.py:0: size=1450 KiB (+1450 KiB), count=15123 (+15123), average=98 B
/usr/local/lib/python3.7/site-packages/hypercorn/protocol/h11.py:0: size=1425 KiB (+1425 KiB), count=8868 (+8868), average=165 B
/usr/local/lib/python3.7/site-packages/channels/http.py:0: size=1398 KiB (+1398 KiB), count=14848 (+14848), average=96 B
/usr/local/lib/python3.7/site-packages/h11/_state.py:0: size=1242 KiB (+1242 KiB), count=13998 (+13998), average=91 B
/usr/local/lib/python3.7/site-packages/h11/_connection.py:0: size=1226 KiB (+1226 KiB), count=15957 (+15957), average=79 B
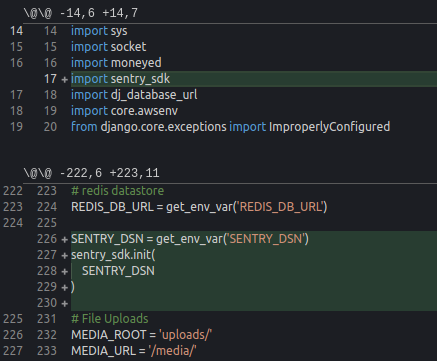
settings.py for the above profile:
Memory profile grouped by line number (more verbose):
/usr/local/lib/python3.7/site-packages/sentry_sdk/integrations/django/__init__.py:272: size=4512 KiB (+4512 KiB), count=33972 (+33972), average=136 B
/usr/local/lib/python3.7/site-packages/sentry_sdk/integrations/django/__init__.py:134: size=4247 KiB (+4247 KiB), count=67945 (+67945), average=64 B
/usr/local/lib/python3.7/linecache.py:137: size=492 KiB (+492 KiB), count=4850 (+4850), average=104 B
/usr/local/lib/python3.7/asyncio/selector_events.py:716: size=415 KiB (+415 KiB), count=2530 (+2530), average=168 B
/usr/local/lib/python3.7/site-packages/sentry_sdk/scope.py:198: size=279 KiB (+279 KiB), count=1 (+1), average=279 KiB
/usr/local/lib/python3.7/site-packages/django/views/generic/base.py:65: size=262 KiB (+262 KiB), count=4783 (+4783), average=56 B
/usr/local/lib/python3.7/socket.py:213: size=237 KiB (+237 KiB), count=2530 (+2530), average=96 B
/usr/local/lib/python3.7/site-packages/ddtrace/span.py:149: size=229 KiB (+229 KiB), count=1765 (+1765), average=133 B
/usr/local/lib/python3.7/site-packages/django/urls/resolvers.py:537: size=229 KiB (+229 KiB), count=390 (+390), average=600 B
/usr/local/lib/python3.7/site-packages/h11/_state.py:261: size=224 KiB (+224 KiB), count=3170 (+3170), average=72 B
/usr/local/lib/python3.7/site-packages/django/contrib/messages/storage/session.py:21: size=211 KiB (+211 KiB), count=3863 (+3863), average=56 B
/usr/local/lib/python3.7/site-packages/rest_framework/request.py:414: size=195 KiB (+195 KiB), count=3565 (+3565), average=56 B
/usr/local/lib/python3.7/functools.py:60: size=194 KiB (+194 KiB), count=1611 (+1611), average=124 B
/usr/local/lib/python3.7/site-packages/ddtrace/vendor/msgpack/fallback.py:847: size=192 KiB (+192 KiB), count=542 (+542), average=363 B
/usr/local/lib/python3.7/site-packages/django/http/request.py:427: size=183 KiB (+183 KiB), count=3335 (+3335), average=56 B
/usr/local/lib/python3.7/site-packages/ddtrace/encoding.py:114: size=171 KiB (+171 KiB), count=6 (+6), average=28.5 KiB
/usr/local/lib/python3.7/site-packages/rest_framework/views.py:478: size=166 KiB (+166 KiB), count=3002 (+3002), average=57 B
/usr/local/lib/python3.7/site-packages/django/utils/datastructures.py:67: size=164 KiB (+164 KiB), count=3006 (+3006), average=56 B
/usr/local/lib/python3.7/asyncio/selector_events.py:581: size=163 KiB (+163 KiB), count=2530 (+2530), average=66 B
/usr/local/lib/python3.7/site-packages/h11/_connection.py:233: size=159 KiB (+159 KiB), count=2263 (+2263), average=72 B
my pip freeze output:
aioredis==1.2.0
amqp==2.5.0
appdirs==1.4.3
asgiref==3.1.4
asn1crypto==0.24.0
astroid==2.2.5
async-timeout==3.0.1
atomicwrites==1.3.0
attrs==19.1.0
autobahn==19.7.1
Automat==0.7.0
autopep8==1.4.4
Babel==2.7.0
billiard==3.6.0.0
boto3==1.9.185
botocore==1.12.185
celery==4.3.0
certifi==2019.6.16
cffi==1.12.3
channels==2.2.0
channels-redis==2.4.0
chardet==3.0.4
Click==7.0
colorama==0.4.1
constantly==15.1.0
coverage==4.5.3
cryptography==2.7
daphne==2.3.0
ddtrace==0.26.0
dj-database-url==0.5.0
Django==2.2.3
django-anymail==6.1.0
django-cors-headers==3.0.2
django-filter==2.1.0
django-ipware==2.1.0
django-money==0.15
django-nose==1.4.6
django-redis==4.10.0
django-storages==1.7.1
django-templated-mail==1.1.1
djangorestframework==3.9.4
djoser==1.7.0
docopt==0.6.2
docutils==0.14
factory-boy==2.12.0
Faker==1.0.7
flower==0.9.3
geoip2==2.9.0
gprof2dot==2017.9.19
graphviz==0.11
green==2.16.1
gunicorn==19.9.0
h11==0.9.0
h2==3.1.0
hiredis==1.0.0
hpack==3.0.0
httptools==0.0.13
Hypercorn==0.7.0
hyperframe==5.2.0
hyperlink==19.0.0
idna==2.8
importlib-metadata==0.18
incremental==17.5.0
isort==4.3.21
jedi==0.14.0
Jinja2==2.10.1
jmespath==0.9.4
kombu==4.6.3
lazy-object-proxy==1.4.1
lxml==4.3.4
MarkupSafe==1.1.1
maxminddb==1.4.1
mccabe==0.6.1
more-itertools==7.1.0
msgpack==0.6.1
nose==1.3.7
objgraph==3.4.1
packaging==19.0
parso==0.5.0
pendulum==2.0.5
Pillow==6.1.0
pipdate==0.3.2
pluggy==0.12.0
prompt-toolkit==2.0.9
psutil==5.6.3
psycopg2-binary==2.8.3
ptpython==2.0.4
py==1.8.0
py-moneyed==0.8.0
pycodestyle==2.5.0
pycparser==2.19
Pygments==2.4.2
PyHamcrest==1.9.0
PyJWT==1.7.1
pylint==2.3.1
pylint-django==2.0.10
pylint-plugin-utils==0.5
pyparsing==2.4.0
python-dateutil==2.8.0
pytoml==0.1.20
pytz==2019.1
pytzdata==2019.2
redis==3.2.1
requests==2.22.0
s3transfer==0.2.1
sentry-sdk==0.10.1
six==1.12.0
sqlparse==0.3.0
text-unidecode==1.2
toml==0.10.0
tornado==5.1.1
Twisted==19.2.1
txaio==18.8.1
typed-ast==1.4.0
typing-extensions==3.7.4
Unidecode==1.1.1
urllib3==1.25.3
uvloop==0.12.2
vine==1.3.0
wcwidth==0.1.7
websockets==7.0
whitenoise==4.1.2
wrapt==1.11.2
wsproto==0.14.1
zipp==0.5.2
zope.interface==4.6.0
I used the official python docker image with the label 3.7, meaning latest 3.7 version.
Hope you guys can figure the problem with this data, I’m not sure if I’ll have the time to contribute myself!
Bonus, memory profiling after 1,000,000 requests (Django Integration using 44MB):
/usr/local/lib/python3.7/site-packages/sentry_sdk/integrations/django/__init__.py:272: size=43.9 MiB (+43.9 MiB), count=338647 (+338647), average=136 B
/usr/local/lib/python3.7/site-packages/sentry_sdk/integrations/django/__init__.py:134: size=41.3 MiB (+41.3 MiB), count=677294 (+677294), average=64 B
/usr/local/lib/python3.7/site-packages/sentry_sdk/scope.py:198: size=2942 KiB (+2942 KiB), count=1 (+1), average=2942 KiB
/usr/local/lib/python3.7/site-packages/django/views/generic/base.py:65: size=2584 KiB (+2584 KiB), count=47252 (+47252), average=56 B
/usr/local/lib/python3.7/site-packages/django/contrib/messages/storage/session.py:21: size=2079 KiB (+2079 KiB), count=38013 (+38013), average=56 B
/usr/local/lib/python3.7/site-packages/rest_framework/request.py:414: size=2006 KiB (+2006 KiB), count=36684 (+36684), average=56 B
/usr/local/lib/python3.7/site-packages/django/http/request.py:427: size=1857 KiB (+1857 KiB), count=33946 (+33946), average=56 B
/usr/local/lib/python3.7/site-packages/django/utils/datastructures.py:67: size=1670 KiB (+1670 KiB), count=30546 (+30546), average=56 B
/usr/local/lib/python3.7/site-packages/rest_framework/views.py:478: size=1547 KiB (+1547 KiB), count=28237 (+28237), average=56 B
/usr/local/lib/python3.7/site-packages/django/contrib/auth/middleware.py:24: size=1518 KiB (+1518 KiB), count=27752 (+27752), average=56 B
/usr/local/lib/python3.7/importlib/__init__.py:118: size=1398 KiB (+1398 KiB), count=25571 (+25571), average=56 B
/usr/local/lib/python3.7/site-packages/django/contrib/messages/storage/__init__.py:12: size=930 KiB (+930 KiB), count=17000 (+17000), average=56 B
/usr/local/lib/python3.7/site-packages/sentry_sdk/tracing.py:123: size=885 KiB (+885 KiB), count=5985 (+5985), average=151 B
/usr/local/lib/python3.7/asyncio/selector_events.py:716: size=664 KiB (+664 KiB), count=4049 (+4049), average=168 B
/usr/local/lib/python3.7/site-packages/django/urls/resolvers.py:541: size=662 KiB (+662 KiB), count=12107 (+12107), average=56 B
/usr/local/lib/python3.7/site-packages/django/http/request.py:584: size=601 KiB (+601 KiB), count=10986 (+10986), average=56 B
/usr/local/lib/python3.7/site-packages/django/core/handlers/exception.py:34: size=592 KiB (+592 KiB), count=10618 (+10618), average=57 B
/usr/local/lib/python3.7/linecache.py:137: size=493 KiB (+493 KiB), count=4875 (+4875), average=104 B
/usr/local/lib/python3.7/site-packages/h11/_state.py:261: size=434 KiB (+434 KiB), count=6142 (+6142), average=72 B
/usr/local/lib/python3.7/site-packages/ddtrace/span.py:149: size=406 KiB (+406 KiB), count=3124 (+3124), average=133 B
Issue Analytics
- State:

- Created 4 years ago
- Reactions:1
- Comments:22 (12 by maintainers)
 Top Related StackOverflow Question
 Troubleshoot Live Code
 Top Related Reddit Thread
 Top Related Hackernoon Post
 Top Related Tweet
 Top Related Dev.to Post
 Top Related Hashnode Post
@astutejoe When 0.10.2 comes out, you can do this to fix your leaks: https://github.com/getsentry/sentry-python/blob/ce3b49f8f0f76939d972868f417dcf9ef78758aa/tests/integrations/django/myapp/asgi.py#L19
got it. we never tested with channels, but have support/testing on our roadmap. the memory leak still shouldn’t happen. we’ll investigate but it could take some time.