
Lightrun Answers was designed to reduce the constant googling that comes with debugging 3rd party libraries. It collects links to all the places you might be looking at while hunting down a tough bug.
And, if you’re still stuck at the end, we’re happy to hop on a call to see how we can help out.
Using Bootstraps grid within a dash app
See original GitHub issueI’m attempting to place a formatted dash application into my django site. For the rest of my web application I’m using bootstrap 4.1.3 via CDN.
<link rel="stylesheet" href="https://stackpath.bootstrapcdn.com/bootstrap/4.1.3/css/bootstrap.min.css" integrity="sha384-MCw98/SFnGE8fJT3GXwEOngsV7Zt27NXFoaoApmYm81iuXoPkFOJwJ8ERdknLPMO" crossorigin="anonymous">
I figured if I use {%plotly_direct name=“SimpleExample” %} to embed my app I should be able to use bootstraps grid system to position the various parts of my application.
Here I have two div’s a graph and a dropdown menu that are meant to each take up half the space:
app.layout = html.Div(children=[
    html.Div([
    html.Div([
        dcc.Graph(
                id='graph_one',
                style={"height": "90%", "width": "98%"},
                config={'modeBarButtonsToRemove':['sendDataToCloud','zoom2d','pan2d','select2d','lasso2d','toggleSpikelines',
                'zoomIn2d','zoomOut2d','autoScale2d','resetScale2d','hoverClosestCartesian','hoverCompareCartesian'],
                'displaylogo':False})],className='col-md-6')
    ,
        html.Div([
    dcc.Dropdown(
    options=[
        {'label': 'New York City', 'value': 'NYC'},
        {'label': 'Montréal', 'value': 'MTL'},
        {'label': 'San Francisco', 'value': 'SF'}
    ],
    value='MTL'
    )],className='col-md-6')
],className='row',)
])
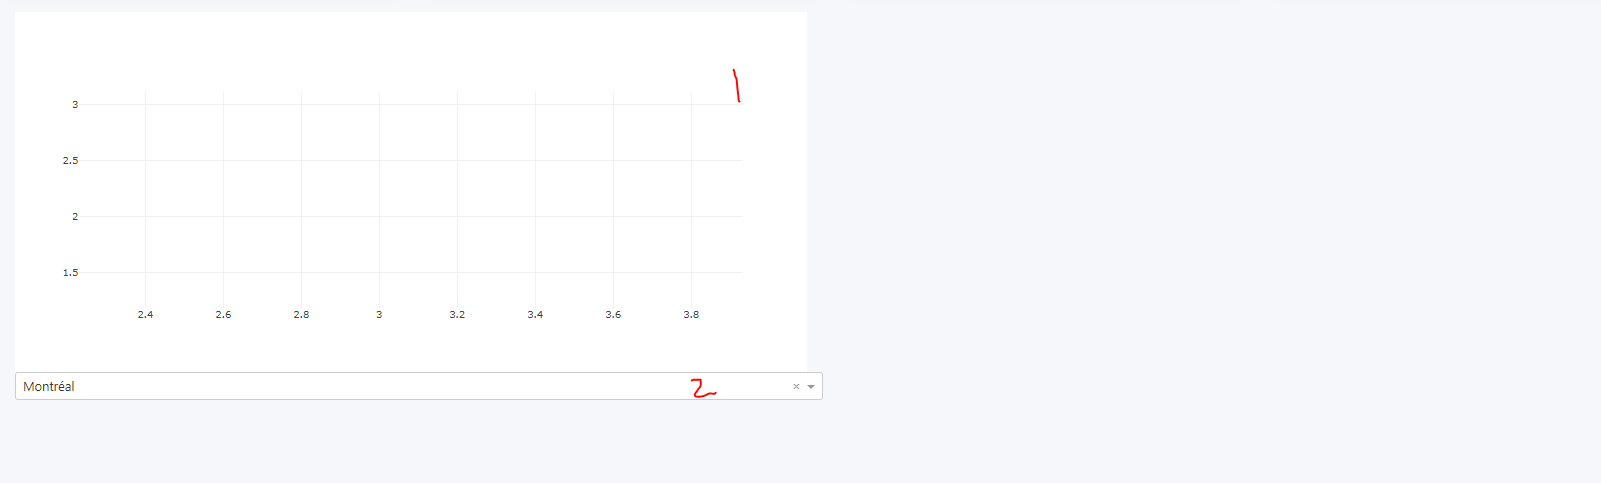
This is the result: It seems height of the entire div is being set really small by something.

I then removed div with className=‘row’ from my code and got the following result:
app.layout = html.Div(children=[
    html.Div([
    html.Div([
        dcc.Graph(
                id='graph_one',
                style={"height": "90%", "width": "98%"},
                config={'modeBarButtonsToRemove':['sendDataToCloud','zoom2d','pan2d','select2d','lasso2d','toggleSpikelines',
                'zoomIn2d','zoomOut2d','autoScale2d','resetScale2d','hoverClosestCartesian','hoverCompareCartesian'],
                'displaylogo':False})],className='col-md-6')
    ,
        html.Div([
    dcc.Dropdown(
    options=[
        {'label': 'New York City', 'value': 'NYC'},
        {'label': 'Montréal', 'value': 'MTL'},
        {'label': 'San Francisco', 'value': 'SF'}
    ],
    value='MTL'
    )],className='col-md-6')
],)
])
This time the graph shows up completely but then the requirements for them to be next to each other is ignored.
Then I thought it might just need to be wrapped in a ‘row’ class within the django template:
    <div class='row'>

        {%plotly_direct name="SimpleExample" %}

    </div>
When i do this, this is the result:

I’m just starting out with django-plotly-dash, so i’m not sure if this is an actual issue or if i’m just not following best practices here.
If its not possible to use the bootstrap grid to position components of my dash app, how would I go about doing that?
Issue Analytics
- State:

- Created 5 years ago
- Comments:7 (3 by maintainers)
 Top Related StackOverflow Question
 Troubleshoot Live Code
 Top Related Reddit Thread
 Top Related Hackernoon Post
 Top Related Tweet
 Top Related Dev.to Post
 Top Related Hashnode Post
Over and above the current workaround needed for bootstrap, the template tags allow you to set a ratio between the height and width of the rendered dash app - this is how the size of the app is determined. Try making the ratio higher to have a bigger app.
There is also issue #35 which looks to enable alternative ways of specifying the size of an app.
This might be e a good question for the Dash community forum or StackOverflow, since it isn’t specific to
django-plotly-dash.https://community.plot.ly/t/bootstrap-rows-columns-with-dash/10590
https://community.plot.ly/t/show-and-tell-dash-bootstrap-components/16614
That said, there is an open issue here regarding compatibility with Dash Bootstrap components:
https://github.com/GibbsConsulting/django-plotly-dash/issues/84