
Lightrun Answers was designed to reduce the constant googling that comes with debugging 3rd party libraries. It collects links to all the places you might be looking at while hunting down a tough bug.
And, if you’re still stuck at the end, we’re happy to hop on a call to see how we can help out.
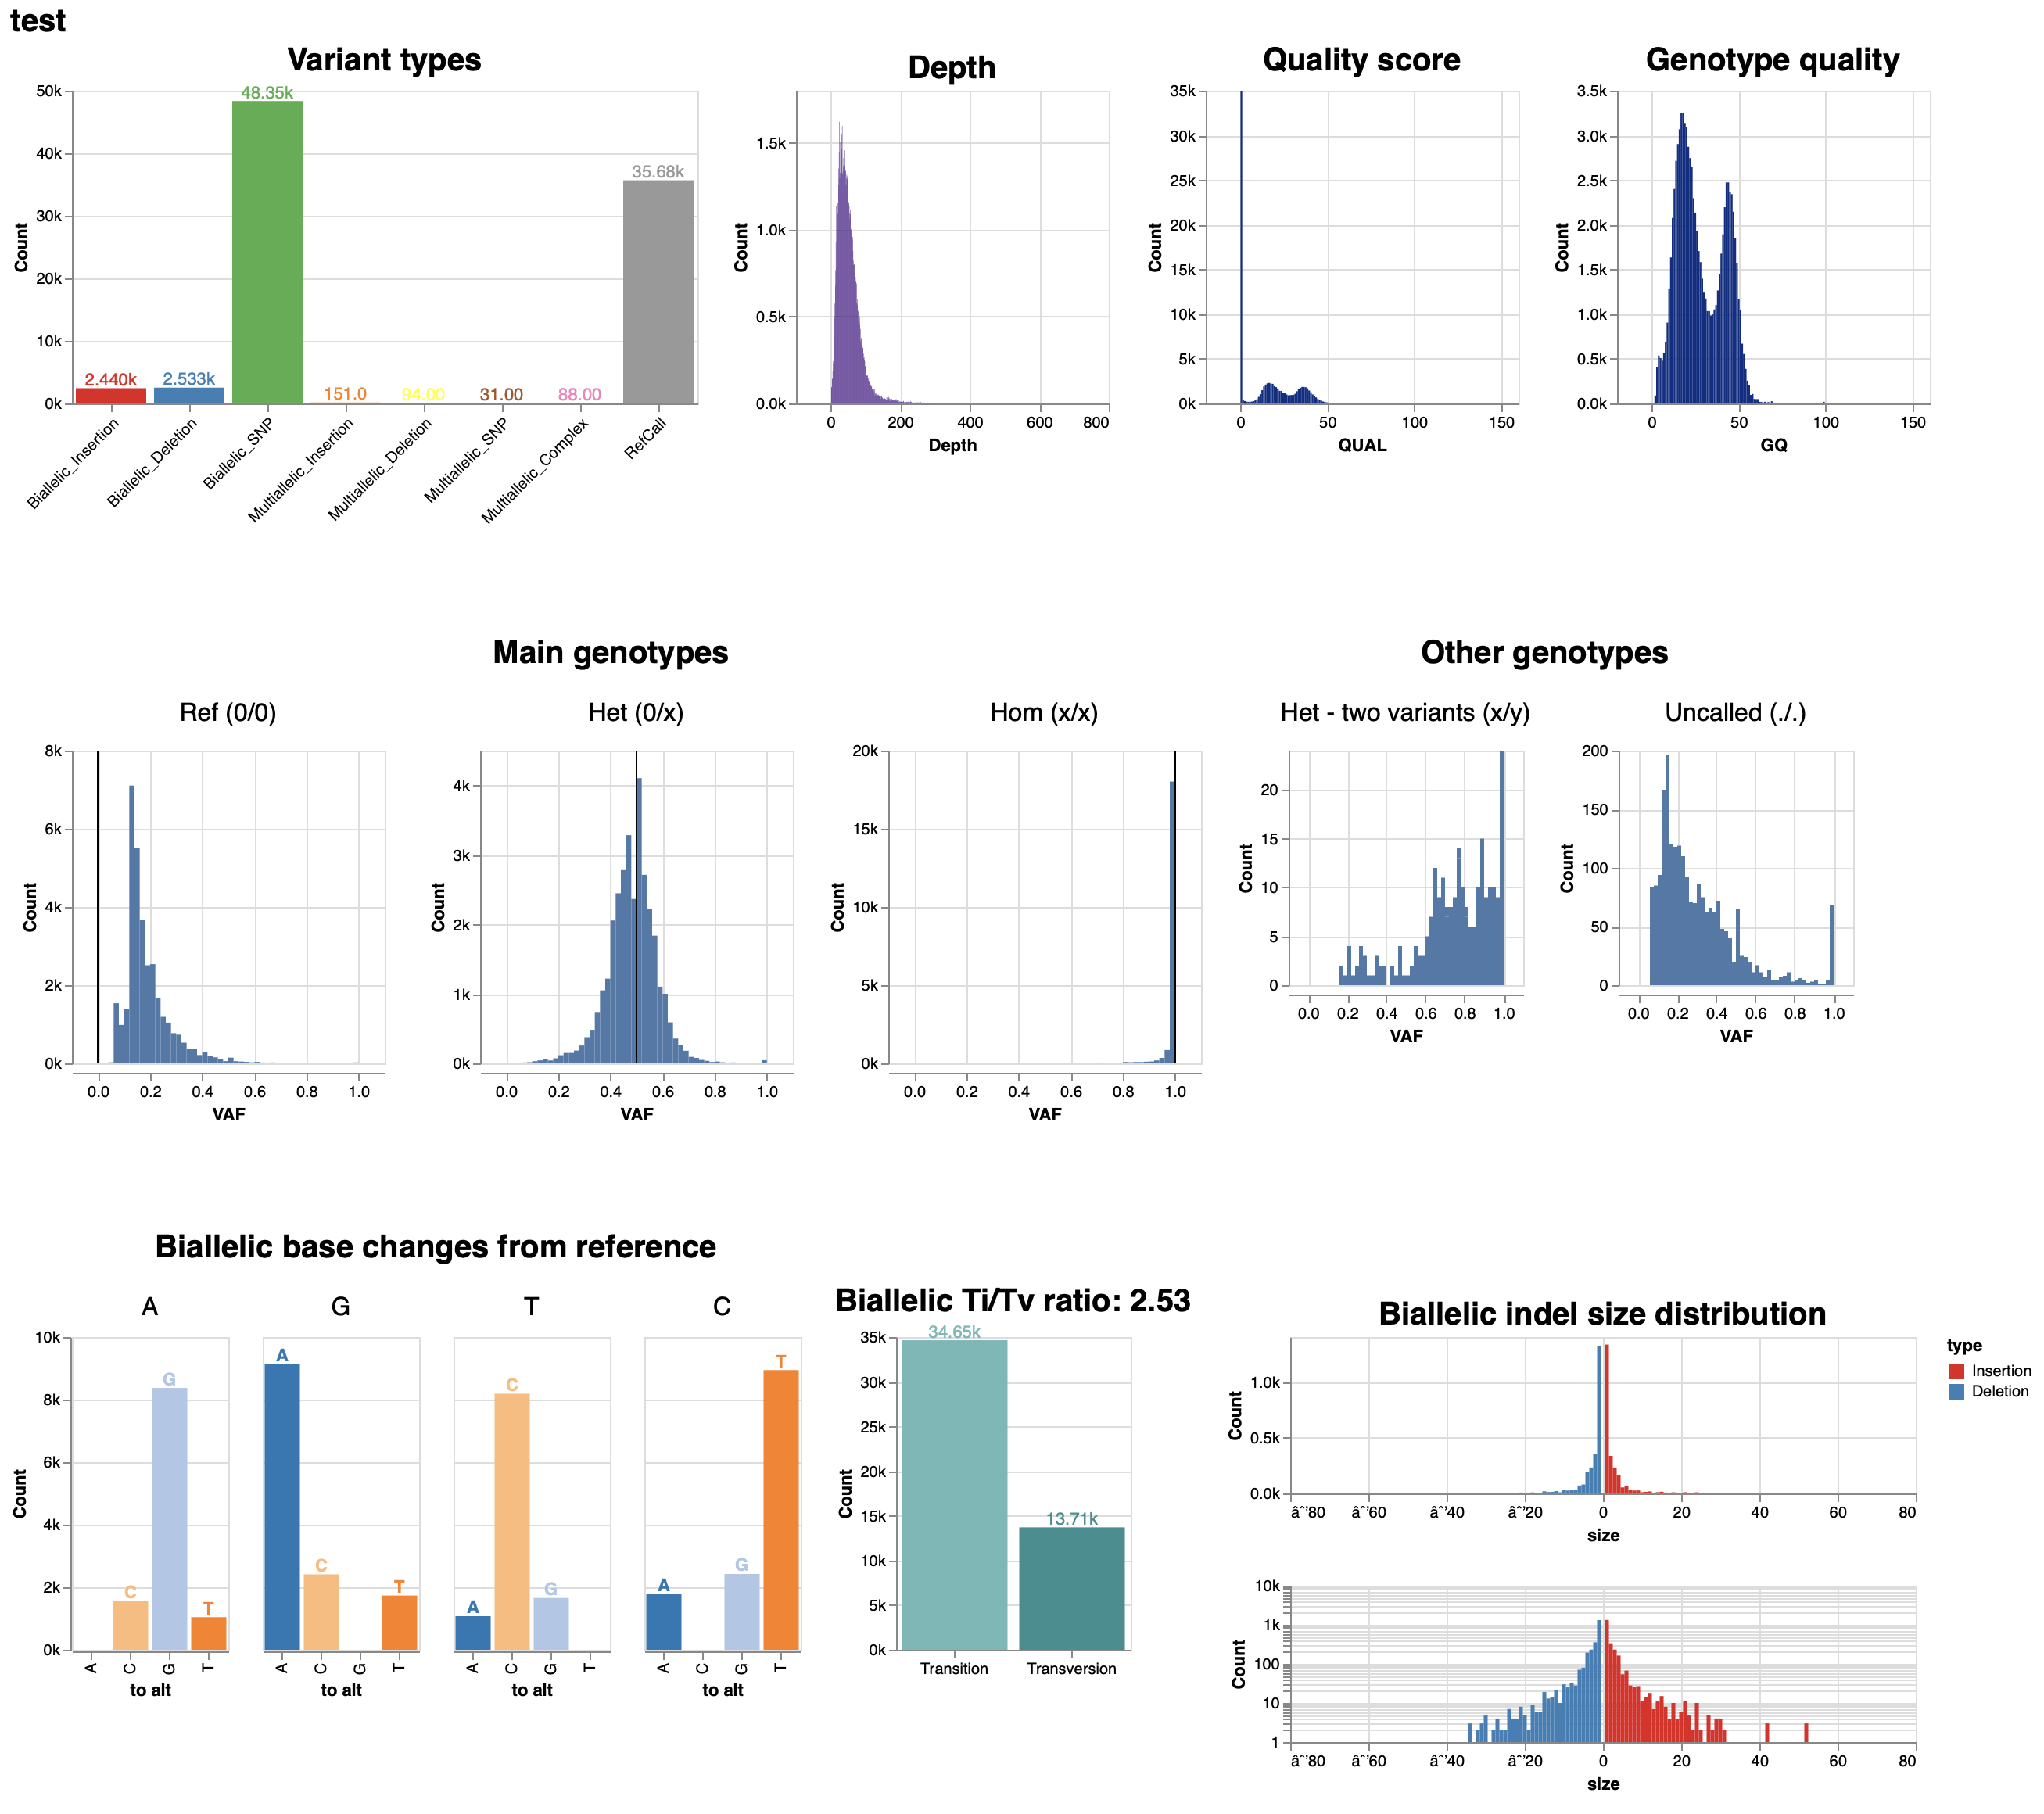
Lower than expected GQ values, with bimodal distribution
See original GitHub issueDescribe the issue: On a specific batch of samples, GQs and QUALs seem to be abnormal. The GQ and QUAL distributions are bimodal and for variants they are much lower than I would expect. It doesn’t seem like there is anything wrong with the calls themselves; I get an expected number of variants. I also can not find anything wrong with the input data. It has high base quality throughout the reads, they are 100bp paired end reads from a NovaSeq with the four value binned base quality scores. This is the visual report for one sample.
Here is an example. I would expect this variant to have a much higher GQ and QUAL. I also have attached deepvariant’s channels png for this variant.
chr1 169421916 . A G 18.4 PASS . GT:GQ:DP:AD:VAF:PL 0/1:17:58:29,29:0.5:18,0,22

Is this expected or is something strange happening here, any insight you can provide would be very appreciated. Thank you
Setup
- Operating system: Ubuntu 20.04
- DeepVariant version: 1.4 (but also 1.2)
- Installation method (Docker, built from source, etc.): Singularity
- Type of data: (sequencing instrument, reference genome, anything special that is unlike the case studies?) Novaseq, 100bp paired, HG38
Steps to reproduce:
singularity run -B /usr/lib/locale/:/usr/lib/locale/ -c --pwd $(pwd) -W $(pwd) -B $(pwd) docker://google/deepvariant:1.4.0 /opt/deepvariant/bin/run_deepvariant --model_type WES --ref $REF --reads $CRAM --output_vcf $VCF --output_gvcf $GVCF --intermediate_results_dir ./int_results --regions $BED
Issue Analytics
- State:

- Created 10 months ago
- Comments:19
 Top Related StackOverflow Question
 Troubleshoot Live Code
 Top Related Reddit Thread
 Top Related Hackernoon Post
 Top Related Tweet
 Top Related Dev.to Post
 Top Related Hashnode Post
Hi @JakeHagen
Thank you for this analysis. This is an interesting observation. I have been some progress on doing the same truncation for the broader exome data we have. It will be interesting to see if that replicates as well.
Either way, the fact that you have generated this effect on public data will be very useful. It will be informative to see what factors we can do to isolate or mitigate the effect. We’re going to do some experiments here.
Thanks again, Andrew
Hi @JakeHagen
Thank you for the report, and for including the quality readout from the HTML file. One thing I want to mention is that this distribution is something that we have seen in some samples - see Figure 1 of Accurate, scalable cohort variant calls using DeepVariant and GLnexus. In this figure, some of the analyzed cohorts do have bimodal GQ distributions for DeepVariant calls, while others (e.g. GIAB) do not.
Supplementary Figure 3 of that paper indicates that a reasonable component of the bimodal distribution relates to sequence depth, at lower sample sequence depths, GIAB becomes more bimodal.
I believe that we internally stratified calls and (though my memory is hazy) found that another factor in the bimodal distribution is whether a site is HET or HOM. Specifically, HET sites with lower depth have lower GQs, and I believe the explanation for this is that as coverage drops, it can become difficult to tell a HET site from either a REF or HOM, while HOM sites have more effective signal for them as non-REF.
I don’t think that the model is likely to be less confident in 100bp reads because they are not as much of the training data, but I expect the fact that 100bp reads are harder to uniquely map and will results in more variability in the coverage of high-MAPQ reads would indirectly contribute.