
Lightrun Answers was designed to reduce the constant googling that comes with debugging 3rd party libraries. It collects links to all the places you might be looking at while hunting down a tough bug.
And, if you’re still stuck at the end, we’re happy to hop on a call to see how we can help out.
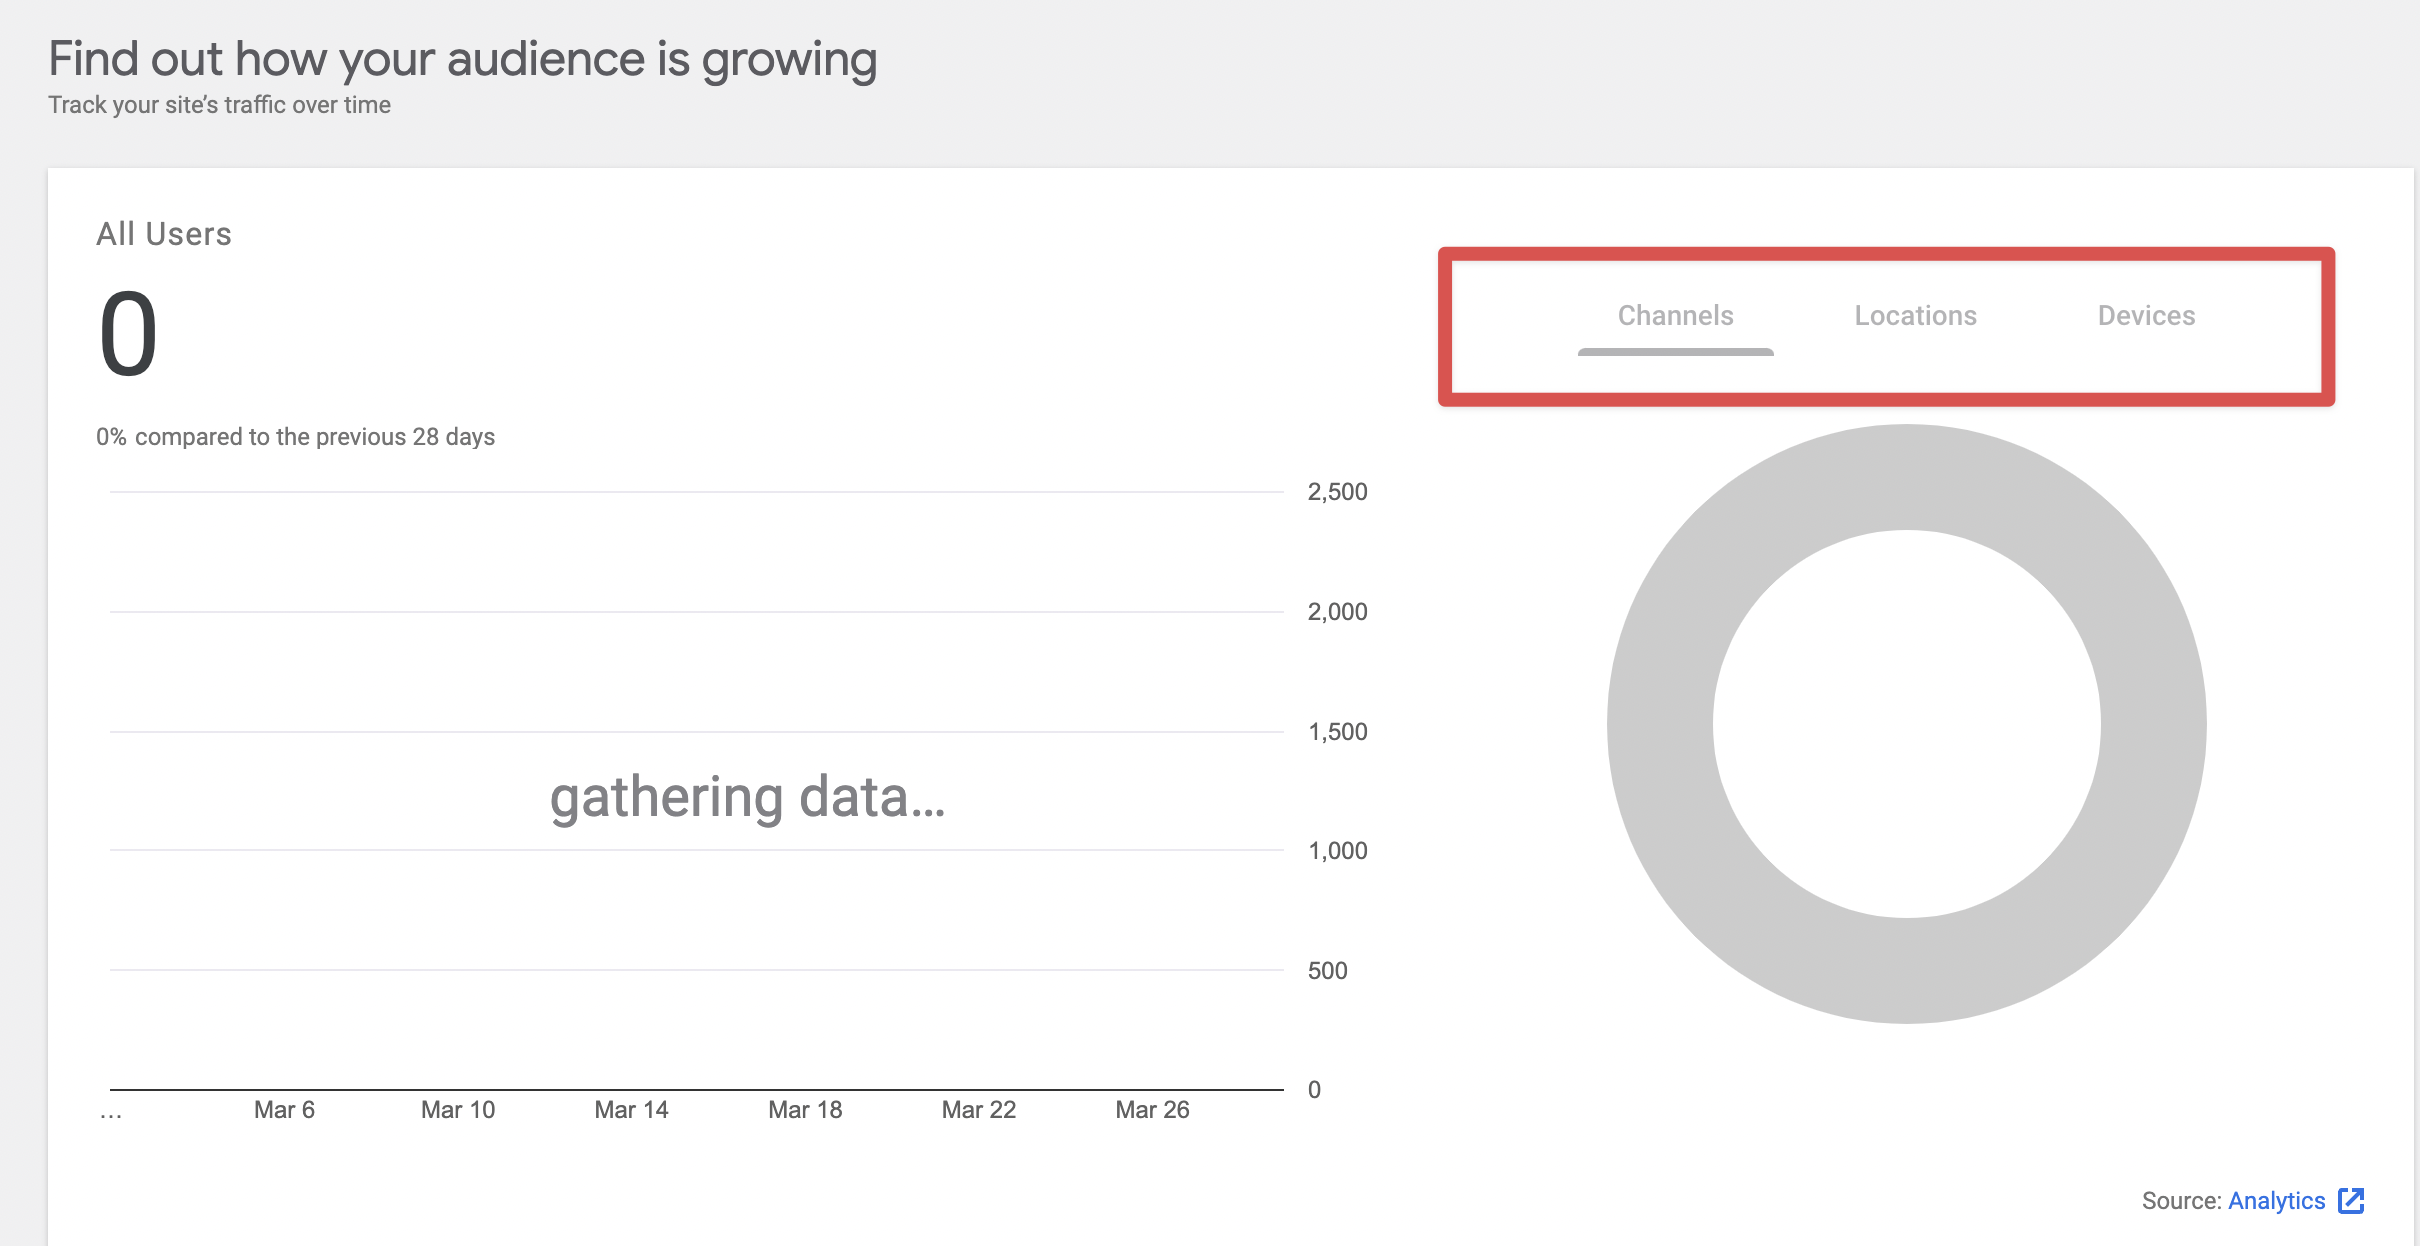
UX/UI issue on All Traffic pie chart tabs when in gathering state
See original GitHub issueBug Description
On a site that is in gathering state. I noticed a UX/UI issue on the All traffic widget on main and entity dashboard. At the top of the pie chart, tabs appear active and when the user clicks on them, nothing happens. It would be better if we can make these tabs look disabled in this state.
Do not alter or remove anything below. The following sections will be managed by moderators only.
Acceptance criteria
- When in “gathering data” state, the tabs in the “All Traffic” widget should appear disabled.
- The cursor should also change to the disabled cursor when hovering over them.
Implementation Brief
- Using
assets/js/modules/analytics/components/dashboard/DashboardAllTrafficWidget/DimensionTabs.js,- Check if there is zero data by querying the analytics data store via the
hasZeroDataselector. - Update the
TabandSelectcomponents to bedisabledby adding whetherhasZeroDataistrueorgatheringData[existing] istrue.
- Check if there is zero data by querying the analytics data store via the
- Using
assets/sass/widgets/_googlesitekit-widget-analyticsAllTraffic.scss,- Add the following styles for:
.mdc-tab[disabled]:cursor: default;
.mdc-tab[disabled] .mdc-tab__ripple:display: none;
.mdc-tab[disabled] .mdc-tab__text-label:opacity: 0.6;color: $c-jumbo;
.mdc-tab--active[disabled] .mdc-tab-indicator__content--underlinebackground-color: $c-jumbo;opacity: 0.6;
- Add the following styles for:
Test Coverage
- No new tests to be added.
QA Brief
- Visit the Site Kit dashboard with Analytics connected in a gathering data state.
- Try to interact with the tabs here:
- They should not be accessible by either keyboard navigation nor mouse input; they should not respond to focus/hover states and essentially be totally disabled.
Also try the above steps, with the zeroDataStates enabled and a site with “zero data” for Analytics. The same outcome should be observed, eg. tabs that are entirely disabled.
Also test both states on mobile and ensure the dropdown is disabled, eg:
The story at https://google.github.io/site-kit-wp/storybook/develop/?path=/story/analytics-module-components-dashboard-all-traffic-widget--zero-data-zerodatastates-enabled should also have disabled tabs instead of tabs that can be interacted with, as this issue also disables the tabs when in a zero data state.
Changelog entry
- Disable All Traffic pie chart tabs when in gathering or zero data state.
Issue Analytics
- State:

- Created a year ago
- Comments:7 (1 by maintainers)
 Top Related StackOverflow Question
 Troubleshoot Live Code
 Top Related Reddit Thread
 Top Related Hackernoon Post
 Top Related Tweet
 Top Related Dev.to Post
 Top Related Hashnode Post
@tofumatt I checked and when the tabs are disabled, they are not tabb-able. I’ve updated the IB, can you review?
I think disabling them here is the best compromise, but we do need to make sure they’re also not interact-able at all, including for keyboard users. So I think the IB is missing removing them from the tab order because they should have no interaction when activated. This probably means ensuring clicking on them doesn’t trigger the tab order changing—is this already the case?
The tabs currently move when there is zero data:
But we should ensure (with a
tabIndex="-1"andonClick={undefined}that nothing happens when users click/activate these, even when they appear disabled.