
Stuck on an issue?
Lightrun Answers was designed to reduce the constant googling that comes with debugging 3rd party libraries. It collects links to all the places you might be looking at while hunting down a tough bug.
And, if you’re still stuck at the end, we’re happy to hop on a call to see how we can help out.
Too much variance in results of chrome's lighthouse and lighthouse-ci results
See original GitHub issueI am trying to integrate in our TravisCI. I am following the configuration below
{
  "ci": {
    "upload": {
      "target": "temporary-public-storage"
    },
    "collect": {
      "additive": false,
      "isSinglePageApplication": true,
      "numberOfRuns": 2,
      "url": [
        "*******private url********"
      ],
      "headful": true,
      "settings": {
        "disableStorageReset": true,
        "emulatedFormFactor": "mobile"
      },
      "maxWaitForLoad": 90000,
      "puppeteerScript": "puppeteer-script/login.js"
    }
  }
}
Lighthouse CI score for mobile(No throttling applied)
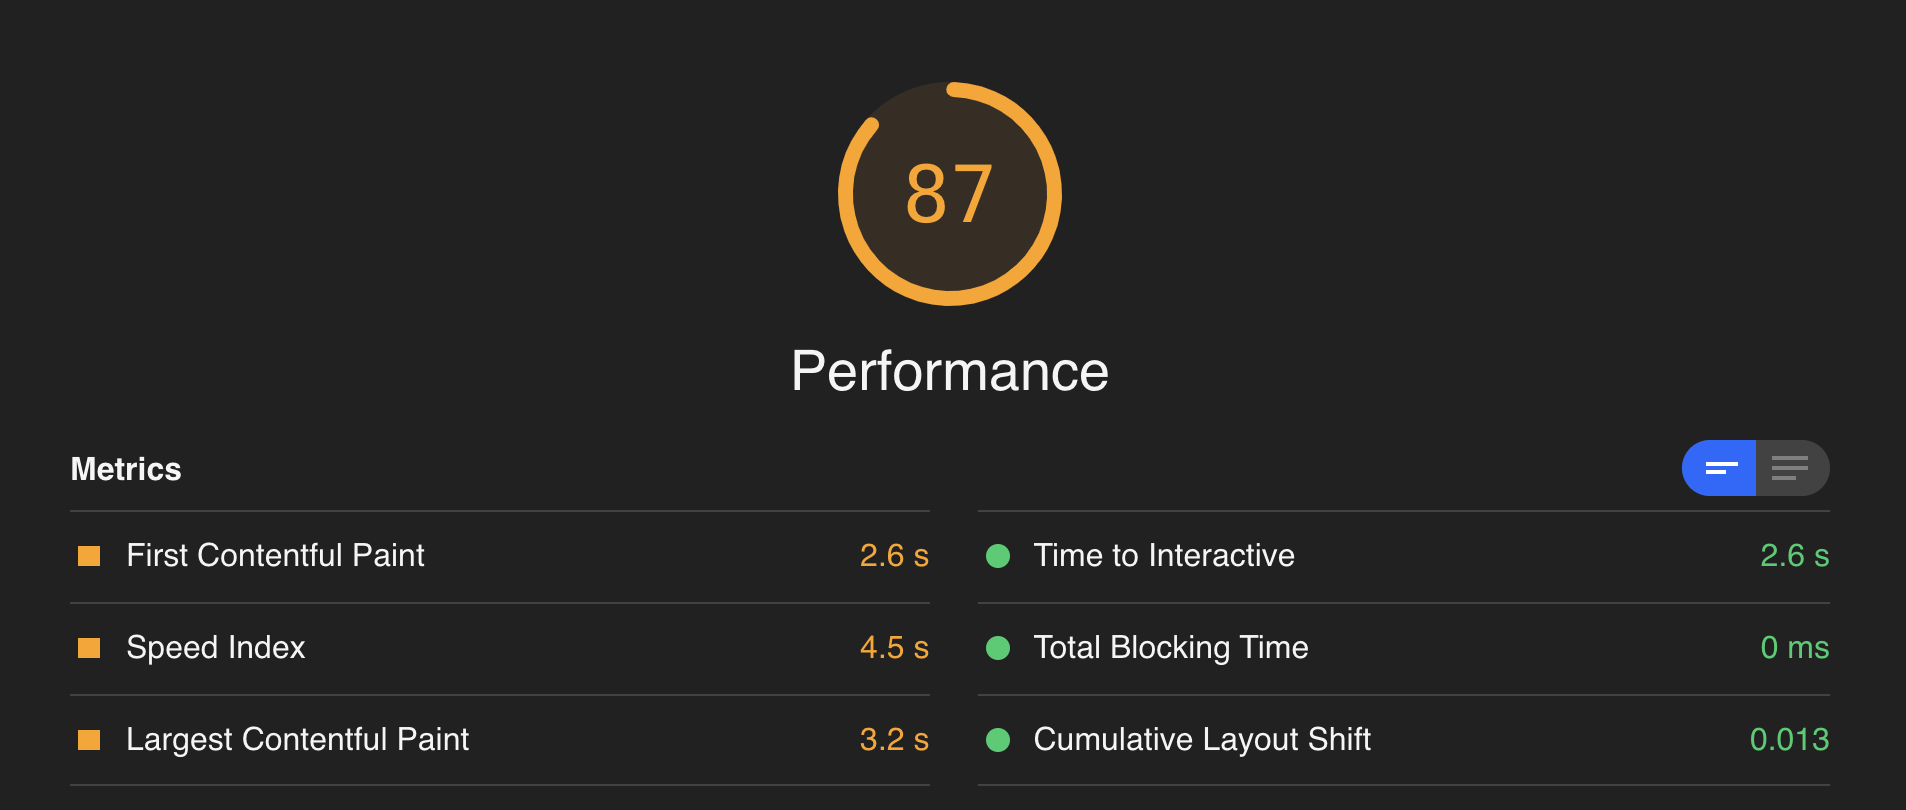 Brower CI score for mobile(Simulated throttling applied)
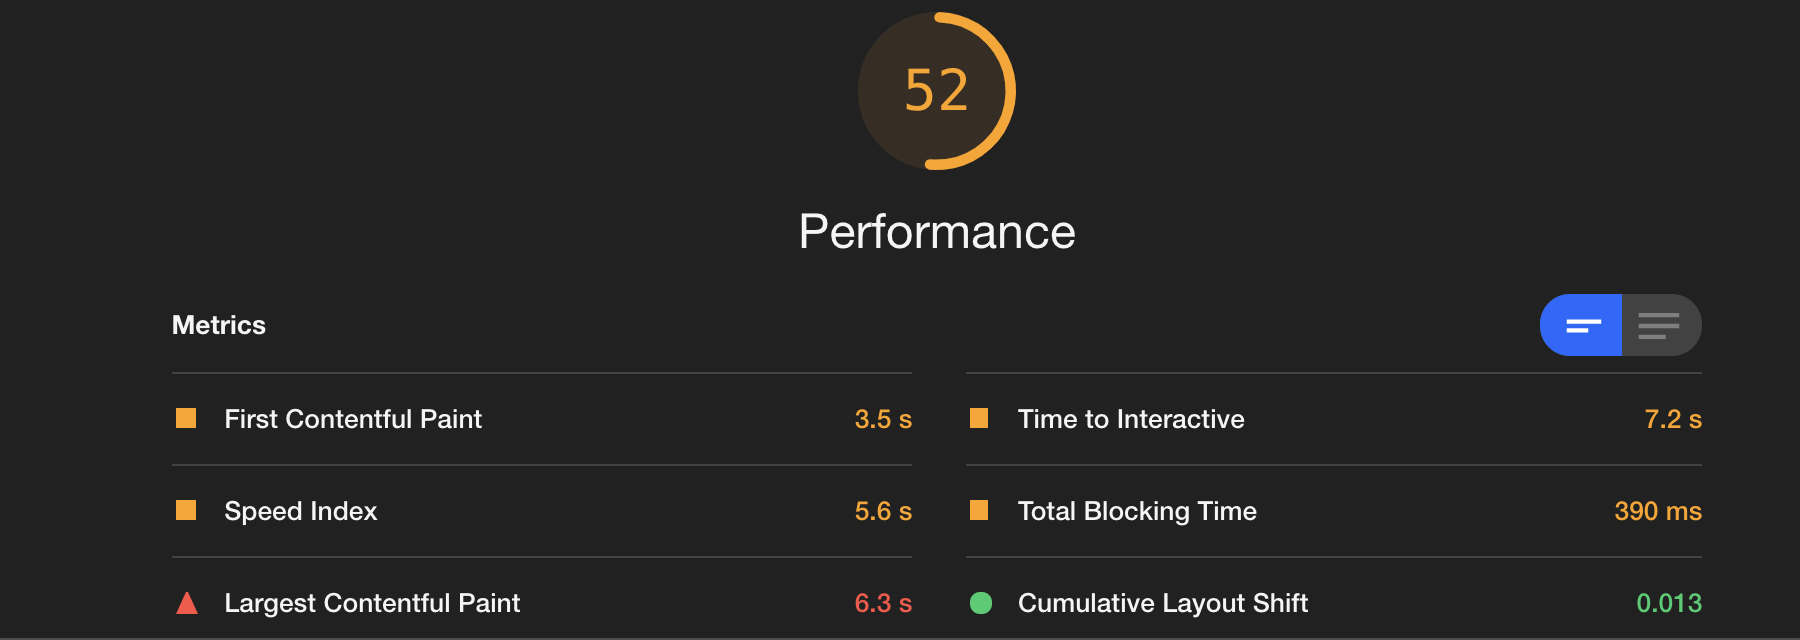
Puppeteer script consists of login related automation. When I am comparing results from Chrome’s lighthouse and LighthouseCI there is a huge difference between both of them. I have also tried different throttling method but no luck.
Issue Analytics
- State:

- Created 3 years ago
- Comments:11
 Top Results From Across the Web
Lighthouse Variability | Tools for Web Developers
A guide on dealing with variance in Lighthouse results.
Read more >Why is my Lighthouse score different from PageSpeed Insights?
When running Lighthouse on your computer or on DebugBear the Performance score may be different from what you see on PageSpeed Insights.
Read more >You're probably using Lighthouse wrong | Vue Storefront
Lighthouse is best at identifying if there was an improvement or decrease in the performance of a specific website, but the actual score...
Read more >Eliminate Lighthouse score variance | SpeedLab Guide
"Lighthouse performance scores will change due to inherent variability in web and network technologies, even if there hasn't been a code change. "...
Read more >Run Lighthouse on GitLab CI - Medium
Measure the performance of a web application with Lighthouse CI in a ... to reduce the variability of the results: a good value...
Read more > Top Related Medium Post
No results found
 Top Related StackOverflow Question
No results found
 Troubleshoot Live Code
Lightrun enables developers to add logs, metrics and snapshots to live code - no restarts or redeploys required.
Start Free Top Related Reddit Thread
No results found
 Top Related Hackernoon Post
No results found
 Top Related Tweet
No results found
 Top Related Dev.to Post
No results found
 Top Related Hashnode Post
No results found
Thanks for filing @nishantdongare!
Please refer to the variability documentation in Lighthouse for expectations around environment differences. In general, it will be incredibly difficult to match low quality, variable hardware in cloud CI environments to numbers from your local machine. Instead, consider CI changes relative to the CI’s baseline (sidenote, reducing the number of runs to just 2 certainly isn’t going to help, if you’re really going to rely on metric and performance data I would use at least 5 if not 9 or more, especially on Travis).
Appreciate the filing of this @nishantdongare but we don’t have the capacity to be able to help debug this sort of issue further. I’ve added this shortcut FAQ to our docs, but that’s about the extent of what we can do right now.
I hope you figure out the discrepancy and please share if you do so others may be aware of it who stumble on this issue in the future! 😃