
Lightrun Answers was designed to reduce the constant googling that comes with debugging 3rd party libraries. It collects links to all the places you might be looking at while hunting down a tough bug.
And, if you’re still stuck at the end, we’re happy to hop on a call to see how we can help out.
ElasticSearch 5.x Group by Terms error (length not defined)
See original GitHub issueHello, I push ntopng data directly into ElasticSearch and i want see some graphics of that information, like the Layer 7 Protocols… well… When i add the PieChart pannel and select the query


The response of elasticsearch is:
{ "request": { "method": "POST", "url": "api/datasources/proxy/9/_msearch", "data": "{\"search_type\":\"query_then_fetch\",\"ignore_unavailable\":true,\"index\":\"ntopng-*\"}\n{\"size\":0,\"query\":{\"bool\":{\"filter\":[{\"range\":{\"@timestamp\":{\"gte\":\"1507891196845\",\"lte\":\"1507912796845\",\"format\":\"epoch_millis\"}}},{\"query_string\":{\"analyze_wildcard\":true,\"query\":\"*\"}}]}},\"aggs\":{\"2\":{\"terms\":{\"field\":\"L7_PROTO_NAME.raw\",\"size\":10,\"order\":{\"_term\":\"desc\"},\"min_doc_count\":1},\"aggs\":{}}}}\n" }, "response": { "responses": [ { "took": 3, "timed_out": false, "_shards": { "total": 5, "successful": 5, "failed": 0 }, "hits": { "total": 125024, "max_score": 0, "hits": [] }, "aggregations": { "2": { "doc_count_error_upper_bound": 0, "sum_other_doc_count": 86260, "buckets": [ { "key": "Yahoo", "doc_count": 4 }, { "key": "Unknown", "doc_count": 459 }, { "key": "Unencrypted_Jabber", "doc_count": 196 }, { "key": "SSL_No_Cert", "doc_count": 19188 }, { "key": "SSL.HTTP", "doc_count": 1 }, { "key": "SSL", "doc_count": 4034 }, { "key": "SSH.HTTP", "doc_count": 1 }, { "key": "SSH", "doc_count": 865 }, { "key": "SSDP", "doc_count": 98 }, { "key": "SMTPS", "doc_count": 12 } ] } }, "status": 200 } ] } }
Issue Analytics
- State:

- Created 6 years ago
- Comments:5
 Top Related StackOverflow Question
 Troubleshoot Live Code
 Top Related Reddit Thread
 Top Related Hackernoon Post
 Top Related Tweet
 Top Related Dev.to Post
 Top Related Hashnode Post
sorry, my bad… i need to set “All” Into value of the options. Thanks @manojown now is working great!!!
actually, grafana support only time series data so you need to select date histogram with @timestam field (means your time series field) then you can view your graph or pie whatever. View the example below.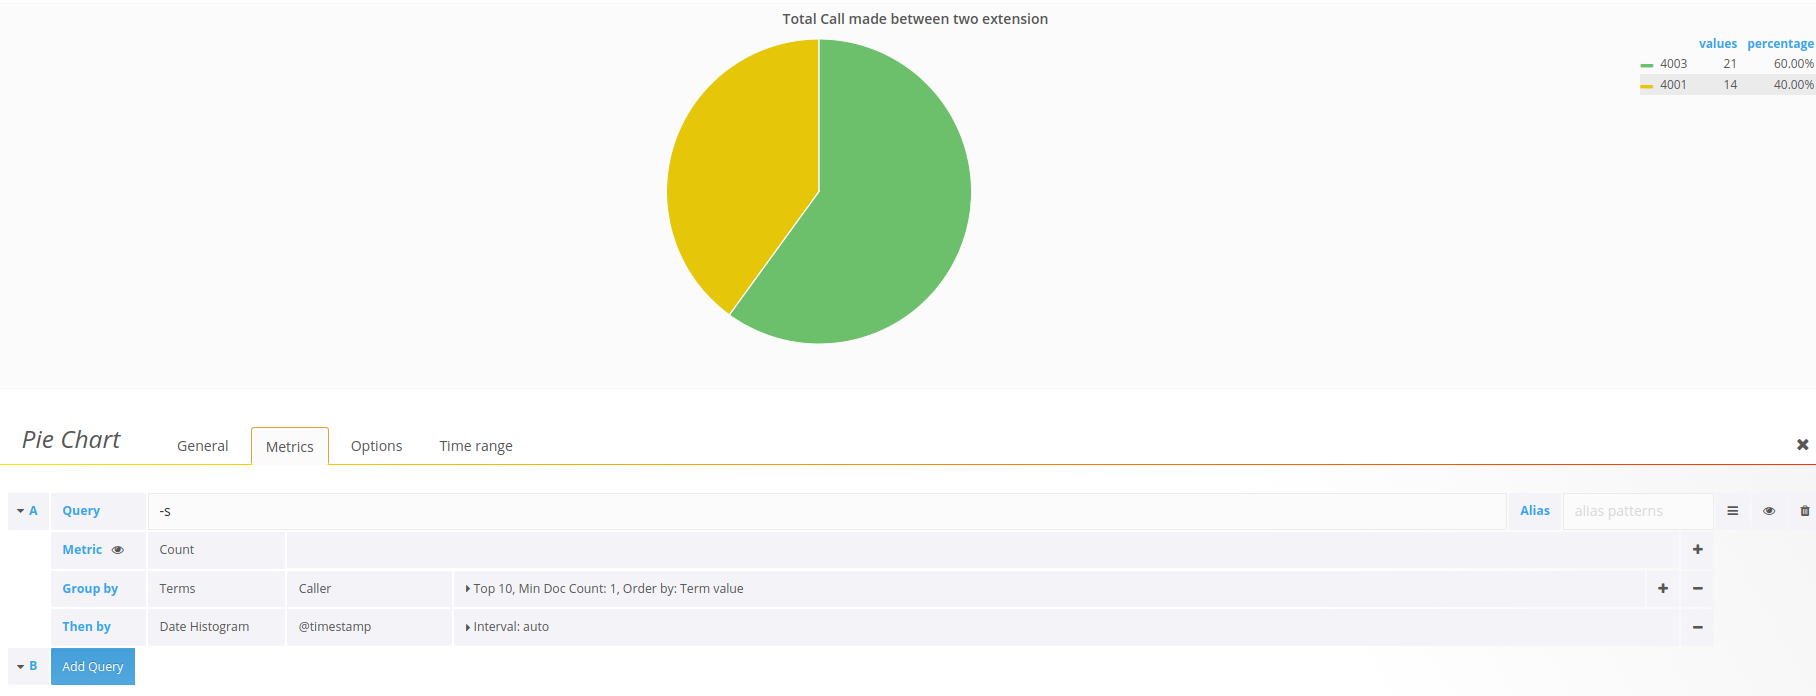 i hope this will help you .