
Lightrun Answers was designed to reduce the constant googling that comes with debugging 3rd party libraries. It collects links to all the places you might be looking at while hunting down a tough bug.
And, if you’re still stuck at the end, we’re happy to hop on a call to see how we can help out.
Bad performance due to GIL when reading groups/datasets
See original GitHub issueRelated https://github.com/h5py/h5py/issues/1516
When reading datasets, or groups, there is a lot of GIL taking and dropping, lead to bad performance in multithreaded environments. I think this is best demonstrated by code:
import os
import sys
import threading

import h5py
import gil_load


try:
    gil_load.init()
    use_gil_load = True
except RuntimeError:
    # skip if not started with python -m gil_load
    use_gil_load = False


names = [f'd{i}' for i in range(20)]
filename = 'test.hdf5'


if not os.path.exists(filename):
    with h5py.File(filename, "w") as f:
        for name in names:
            f.create_dataset(name, (20,), dtype='i8')

f = h5py.File(filename)
def run():
    _ = [f[name] for name in names]

def main(argv=sys.argv):
    threads = [threading.Thread(target=run) for _ in range(int(sys.argv[1]))]
    if use_gil_load:
        gil_load.start()
    for thread in threads:
        thread.start()
    for thread in threads:
        thread.join()
    if use_gil_load:
        gil_load.stop()
        stats = gil_load.get()
        print(gil_load.format(stats))

main()
This can be run using gilload, e.g.
$ python -m gil_load use_case/h5pygil.py 10                                                                   dev
held: 0.81 (0.81, 0.81, 0.81)
wait: 0.952 (0.952, 0.952, 0.952)
...
Which means the GIL is held often, and the threads often have to wait for the GIL.
This was a good test case for a GIL visualization/performance tool I’ve been working on, to see if we can get a better handle on this. Installing https://github.com/maartenbreddels/per4m (it’s still a rough tool).
$ giltracer --state-detect ./use_case/h5pygil.py 3
...
Summary of threads:

PID         total(us)    no gil%✅    has gil%❗    gil wait%❌
--------  -----------  -----------  ------------  -------------
2793256*      59912.6         97.6           1.8            0.6
2793330        8984.5         14.0          26.7           59.3
2793331        8351.3         14.2          28.5           57.3
2793332        8130.1         13.6          27.6           58.8

High 'no gil' is good (✅), we like low 'has gil' (❗),
 and we don't want 'gil wait' (❌). (* indicates main thread)
....
We also see that the 3 worker threads have to wait for the GIL ~50% of the time. The VizTracer output gives us:
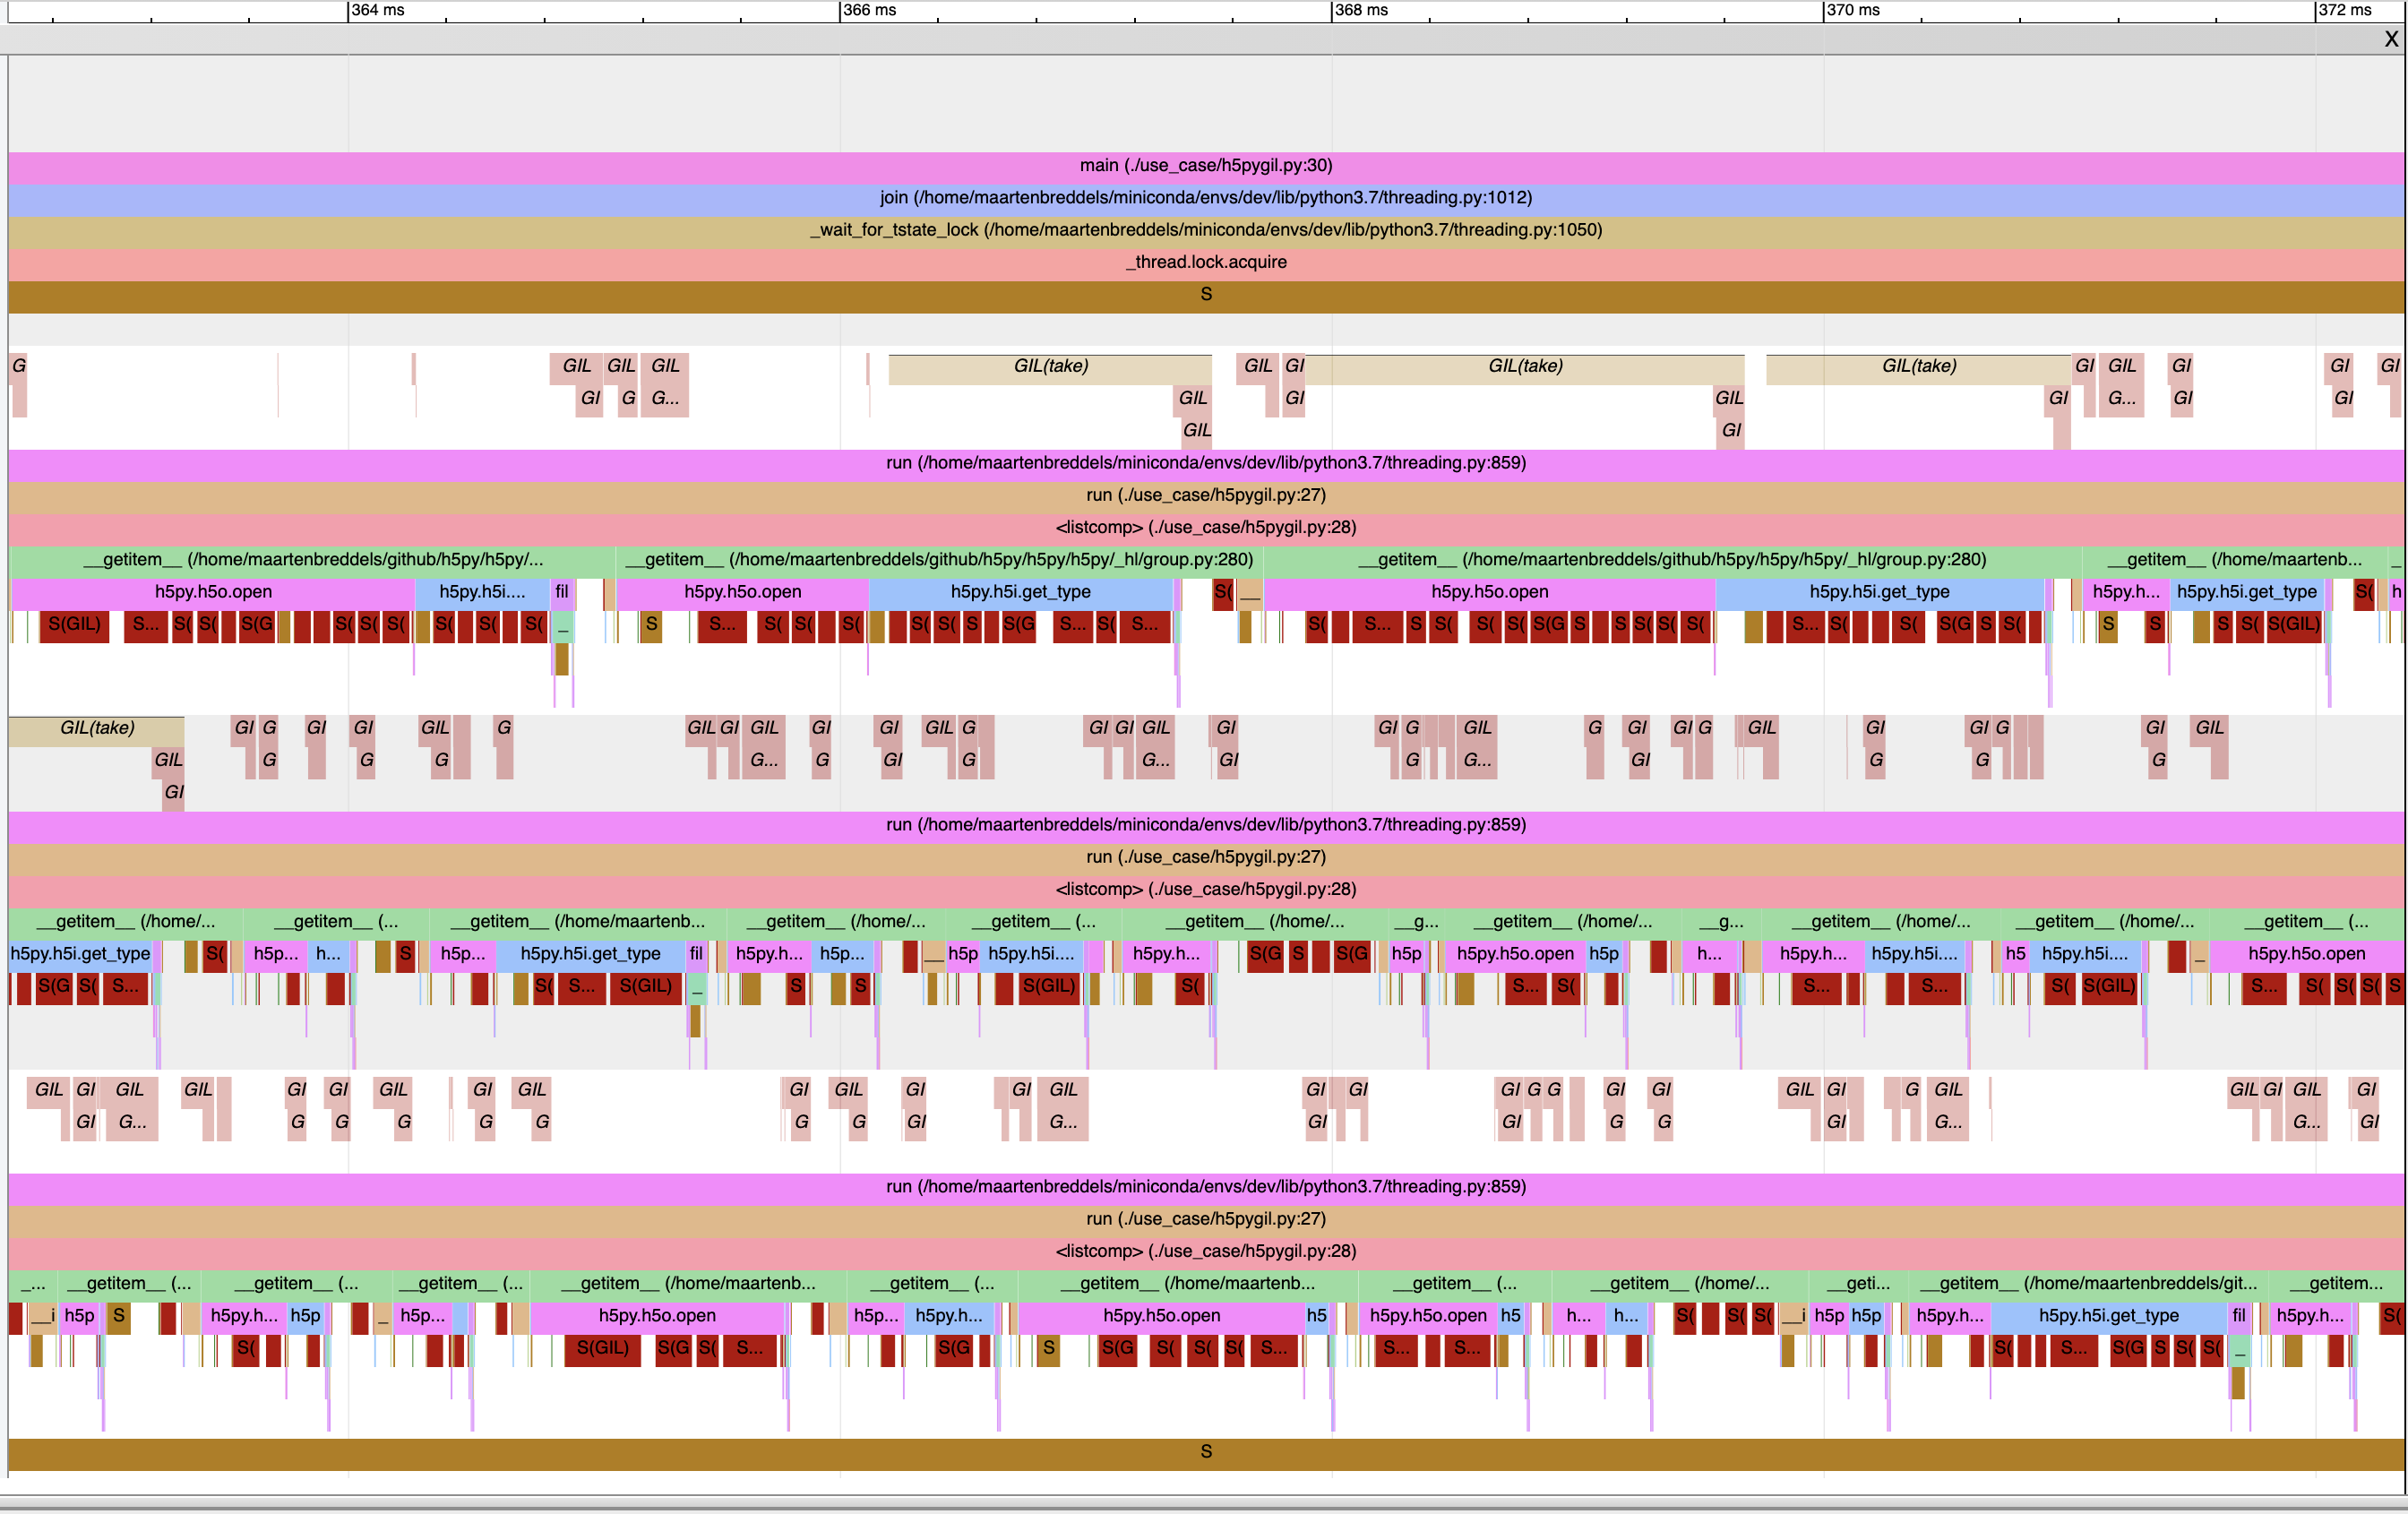
The dark red blocks below the callstack with ‘S(GIL)’ in it are when a thread is in a sleeping state due to the GIL (and you see it often waking up, to check if it can continue). The light red/pink with ‘GIL’ cursive in it above the callstack, is when the GIL is taken. From this I think I can conclude that the h5o.open and h5i.get_type do not release the GIL.
A different view of this is a flamegraph of the callstack when the GIL is not held, and the process/thread is not running:

Unfortunately I could not restore the Python callstack, but we see that ~50% of the ‘offcpu, offgil time’ is held by __pyx_f_4h5py_4defs_H5Oopen (on the right).
I wonder what the best approach here is, even if we can release the GIL, it will be taken very often on function exit again. maybe a better way to attach this issue it for instance that group.items() will do a single function call into cython/c without the GIL. Note that per4m/giltracer is very experimental, but I think the GIL claims are correct.
Issue Analytics
- State:

- Created 3 years ago
- Reactions:1
- Comments:6 (4 by maintainers)
 Top Related StackOverflow Question
 Troubleshoot Live Code
 Top Related Reddit Thread
 Top Related Hackernoon Post
 Top Related Tweet
 Top Related Dev.to Post
 Top Related Hashnode Post
I’m using master, cheers
(from mobile phone)
On Tue, Dec 22, 2020, 20:48 Thomas A Caswell notifications@github.com wrote:
Ah, I see I am wrong about how much we drop the gil (the layer that builds the bottom most cython wrappers is controled by https://github.com/h5py/h5py/blob/master/h5py/api_functions.txt and the functions where we drop the gil are makred with
nogilwhich seems to mostly be the dataset operations). I think what this will enable is to not block computation while doing I/O. In the cases where open is waiting for the GIL it is because the interpreter took it away from that thread (rather than the code positively dropping it)? If that is the case, I think most of my analysis above should be disregarded, sorry for the noise.I stand by doing a careful audit of all of our layers of locking being valuable, but likely a lot of work and the hdf5 c++ level library lock is likely to be the biggest problem here.