
Lightrun Answers was designed to reduce the constant googling that comes with debugging 3rd party libraries. It collects links to all the places you might be looking at while hunting down a tough bug.
And, if you’re still stuck at the end, we’re happy to hop on a call to see how we can help out.
Recreating a histogram from the percentile distribution output provides same percentiles, but different summary (mean, max, stddev)
See original GitHub issueI have a scenario where I’m using HDRHistogram and it’s .toJSON() as a standard interface between several different tool outputs.
One of them is wrk2, which provides it’s own stat output object, and HDRHistogram percentile distribution at the end of the run, but it’s more useful to reverse that and rebuild the actual Histogram object in Node so that I can call toJSON() (or whatever else) on it and have a standardized class/object.
The conundrum is this:
If you parse the output of hdr.outputPercentileDistribution(), and use that to rebuild the initial histogram, the final result is slightly different.
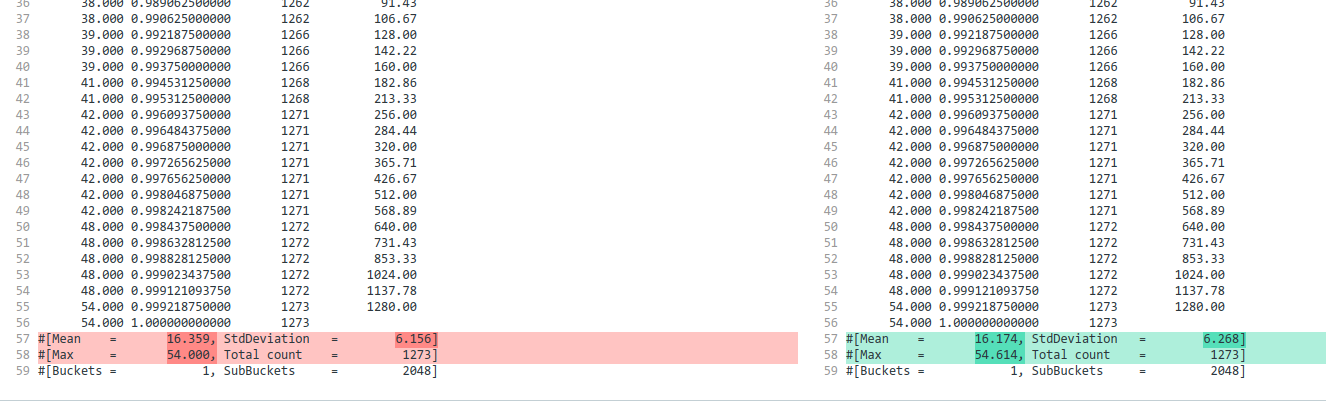 https://www.diffchecker.com/8dwIT5h3
Demo of the issue here (just open and it should print to console pane on righthand side): https://codesandbox.io/s/frosty-night-0noxy?file=/src/index.ts:5627-6019
interface ParsedHDRHistogramSummary {
  buckets: number
  count: number
  max: number
  mean: number
  stddev: number
  sub_buckets: number
}

interface ParsedHDRHistogramValue {
  value: number
  percentile: number
  total_count: number
  of_one_percentile: number
}

interface ParsedHDRHistogram {
  summary: ParsedHDRHistogramSummary
  values: ParsedHDRHistogramValue[]
}

function convertPropertiesTo(type, obj) {
  for (let k in obj) obj[k] = type(obj[k])
  return obj
}

function parseHdrHistogram(text: string): ParsedHDRHistogram {
  let valuesRegex = new RegExp(
    /(?<value>\d+\.?\d*)[ ]+(?<percentile>\d+\.?\d*)[ ]+(?<total_count>\d+\.?\d*)([ ]+(?<of_one_percentile>\d+\.?\d*))?/g
  )

  // prettier-ignore
  let summaryRegex = new RegExp(
    /#\[Mean    =       (?<mean>\d+\.?\d*), StdDeviation   =        (?<stddev>\d+\.?\d*)]/.source + "\n" +
    /#\[Max     =       (?<max>\d+\.?\d*), Total count    =         (?<count>\d+\.?\d*)]/.source + "\n" +
    /#\[Buckets =            (?<buckets>\d+\.?\d*), SubBuckets     =         (?<sub_buckets>\d+\.?\d*)]/.source,
    'g'
  )

  // prettier-ignore
  const values: ParsedHDRHistogramValue[] = [...text.matchAll(valuesRegex)]
    .flatMap((it) => convertPropertiesTo(Number, it.groups as any))

  const summary: ParsedHDRHistogramSummary = [...text.matchAll(summaryRegex)]
    .flatMap((it) => convertPropertiesTo(Number, it.groups as any))
    .pop()

  return { summary, values }
}

// Calculates the amount of values per point in the percentile output
function calculateHistogramIntervalCounts(values: ParsedHDRHistogramValue[]) {
  type HistogramPoint = { amount: number; value: number }
  let res: HistogramPoint[] = []

  let lastCount = 0
  for (let entry of values) {
    let amount = entry.total_count - lastCount
    let value = Math.round(entry.value)
    res.push({ amount, value })
    lastCount = entry.total_count
  }

  return res
}

function reconstructHdrHistogramFromParsed(parsedHistogram: ParsedHDRHistogram) {
  const histogram = hdr.build()
  const intervals = calculateHistogramIntervalCounts(parsedHistogram.values)
  for (let entry of intervals)
    histogram.recordValueWithCount(entry.value, entry.amount)
  return histogram
}

const reconstructHdrHistogramFromText = (text: string) =>
  reconstructHdrHistogramFromParsed(parseHdrHistogram(text))
Issue Analytics
- State:

- Created 3 years ago
- Comments:7 (4 by maintainers)
 Top Related StackOverflow Question
 Troubleshoot Live Code
 Top Related Reddit Thread
 Top Related Hackernoon Post
 Top Related Tweet
 Top Related Dev.to Post
 Top Related Hashnode Post
Thanks for your kind words! I guess the
1/(1-percentile)is useful to plot the data, it will be used as the ‘x’ in the graph. This is not obvious looking at the code but if you want you can take a look hereAfter thinking a little bit about how the output is built, this is not surprising that after parsing you get a good distribution and a not so good summary. This is because in the output you have less information than in the whole histogram. If you take a look at this code fragment :
You get the following output:
Looking at this output there is no way to say that there was one record for each value between 0 and 500. If you take a look at the first lines, you can say that there were 50 records for value 49 or less, that is it…
Since HdrHistogram_C has a hdr_encode_compressed() function, I guess a solution would be to ask @giltene if it would be a good think to add an option in wrk2 to get the results as a base64 compressed string.