
Lightrun Answers was designed to reduce the constant googling that comes with debugging 3rd party libraries. It collects links to all the places you might be looking at while hunting down a tough bug.
And, if you’re still stuck at the end, we’re happy to hop on a call to see how we can help out.
[BUG] - some plots disappearing/not displaying properly after update_data()/update_gfx() calls
See original GitHub issueRequirements (place an x in each of the [ ])**
- I realize finplot is not a web lib. (Hint: it’s native!)
- I’ve read the snippets and not found what I’m looking for.
- I’ve searched for any related issues and avoided creating a duplicate issue.
- I’ve updated finplot (
pip install -U finplot). - I’ve supplied the required data to run my code below.
Code to reproduce
import finplot as fplt
import pandas as pd
import io

# -- make a chart with 2 row with a plot in each --

data = """time,vol
          2020-08-01T00:00:00,134.18994254
          2020-08-01T00:05:00,28.68361201
          2020-08-01T00:10:00,95.9841699
          2020-08-01T00:15:00,25.52036882
          2020-08-01T00:20:00,32.99362203
          2020-08-01T00:25:00,272.87459159
          2020-08-01T00:30:00,65.2196942
          2020-08-01T00:35:00,74.78479433
          2020-08-01T00:40:00,46.8928428
          2020-08-01T00:45:00,42.36720822
          2020-08-01T00:50:00,22.21062411
          2020-08-01T00:55:00,39.78889563
          2020-08-01T01:00:00,33.73745861
          2020-08-01T01:05:00,36.34563807
          2020-08-01T01:10:00,36.1138157
          2020-08-01T01:15:00,40.76047654
          2020-08-01T01:20:00,22.53141467
          2020-08-01T01:25:00,18.07777984
          2020-08-01T01:30:00,29.34292546
          2020-08-01T01:35:00,34.43111442
          2020-08-01T01:40:00,15.24503765
          2020-08-01T01:45:00,26.6317692"""

df = pd.read_csv(io.StringIO(data))
df = df.astype({'time':'datetime64[ns, UTC]'})

ax1,ax2 = fplt.create_plot("improper plot problem", rows=2, maximize=False)

plot1 = fplt.plot(df["time vol".split()], ax=ax1, legend="test1")
plot2 = fplt.plot(df["time vol".split()], ax=ax2, legend="test2")

# ** df is updated with additional data here, but is omitted for clarity **

# -- now update the charts with updated df (à la issue #131 example) --
plot1.update_data(df["time vol".split()], gfx=False)
plot2.update_data(df["time vol".split()], gfx=False)

# --> these calls cause a blank chart on the ax2 plot
# (a zoom or scroll on the chart will cause the plot to reappear)
plot1.update_gfx()
plot2.update_gfx()

fplt.show()
Describe the bug
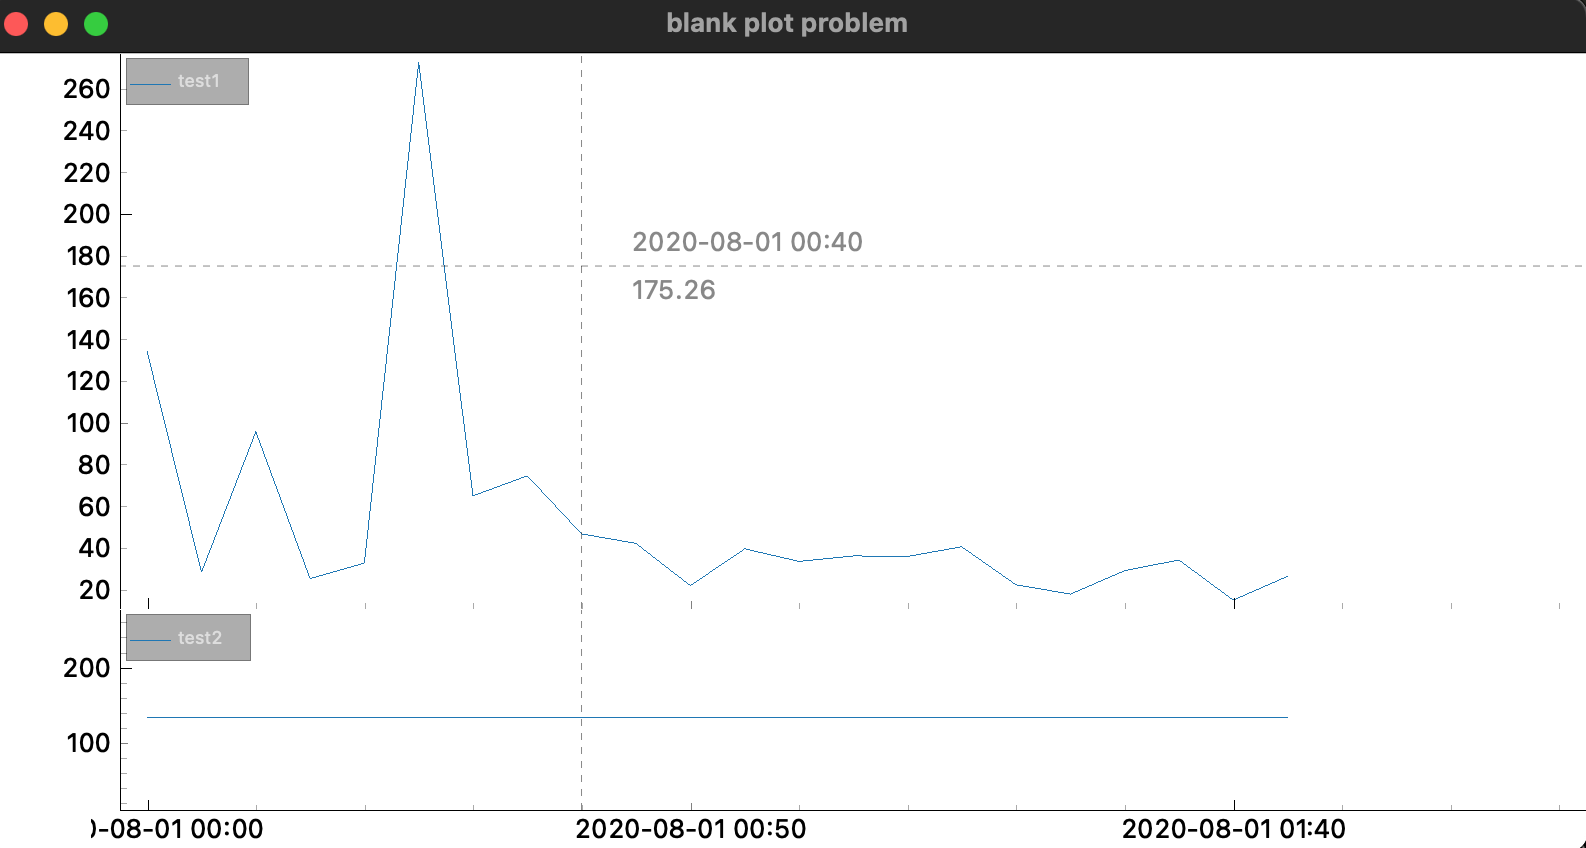
On a 2 row chart, updating the plot data will cause the second plot to not dispay properly.
This appears to be a bug introduced in commit 1190e8a (on 2021-07-08) where round() is replaced with _round(). Roll back to the previous commit and the bug disappears.
Expected behavior
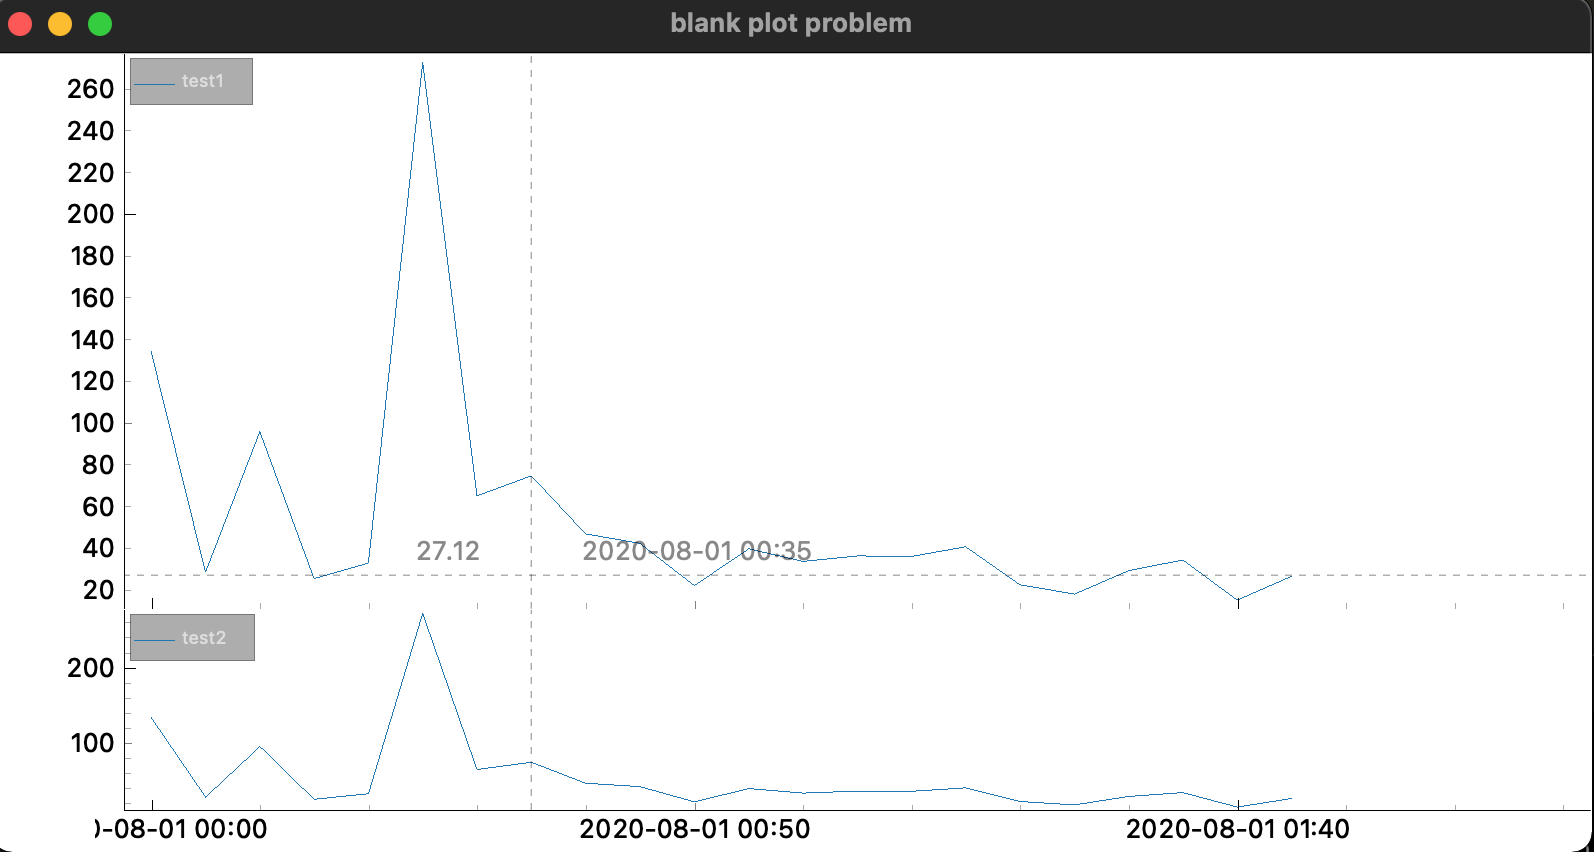
Both plots should remain visible after update_gfx() call. Currently, a manual scroll or zoom is needed to cause the second plot to appear after the update_data()/update_gfx() calls.
Screenshots
Bug version (current HEAD 2021-07-15 516db43):
Roll back to previous commit (ccecee7):
Reproducible in:
OS: macOS 11.5 finplot version: current HEAD (2021-07-15 516db43) pyqtgraph version: pyqtgraph-0.12.1 pyqt version: PyQt5_Qt5-5.15.2
Issue Analytics
- State:

- Created 2 years ago
- Comments:6 (3 by maintainers)
 Top Related StackOverflow Question
 Troubleshoot Live Code
 Top Related Reddit Thread
 Top Related Hackernoon Post
 Top Related Tweet
 Top Related Dev.to Post
 Top Related Hashnode Post
Yes, that’s got it. And thank you for finplot!
Thanks, put the edge case fix in 925e706.