
Lightrun Answers was designed to reduce the constant googling that comes with debugging 3rd party libraries. It collects links to all the places you might be looking at while hunting down a tough bug.
And, if you’re still stuck at the end, we’re happy to hop on a call to see how we can help out.
Memory leak
See original GitHub issueHello!
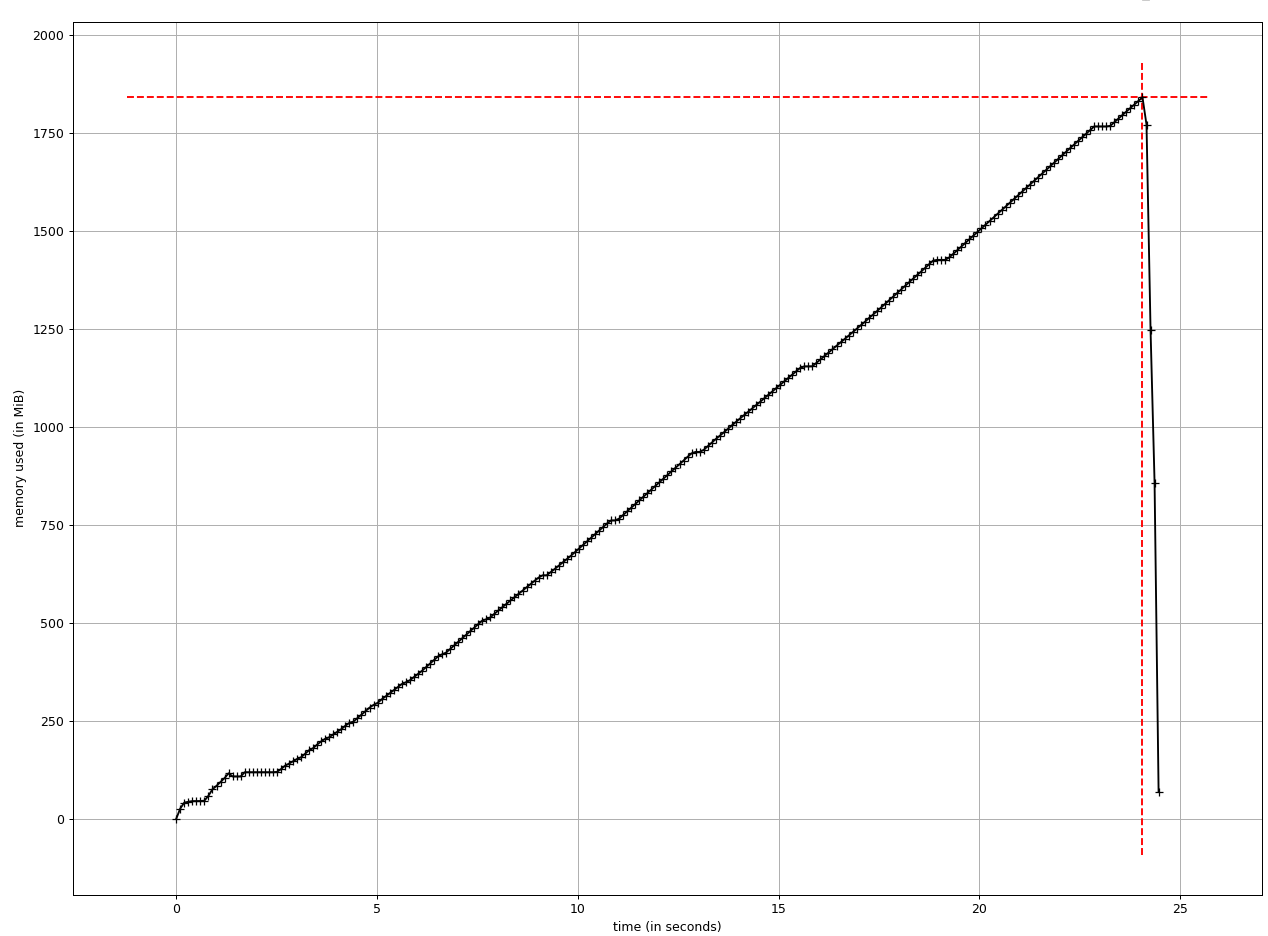
I was benchmarking fastjsonschema against other Python implementations and at some point, fastjsonschema took too much memory (~30 GB) and I killed the process.
Schema: Official Swagger JSON Schema
Instance: Kubernetes API definition from API.guru
Interpreter: CPython 3.9.1 with platform.platform() as Linux-5.10.11-arch1-1-x86_64-with-glibc2.32
Other implementations (jsonschema and jsonschema-rs) didn’t demonstrate high memory usage on the same input.
Dependencies:
pip install fastjsonschema==2.14.5 requests==2.25.1 PyYAML==5.4.1
Code to reproduce:
import fastjsonschema
import requests
import yaml
import time

try:
    from yaml import CSafeLoader as Loader
except ImportError:
    from yaml import SafeLoader as Loader

SCHEMA_URL = "https://raw.githubusercontent.com/OAI/OpenAPI-Specification/master/schemas/v2.0/schema.json"
INSTANCE_URL = "https://raw.githubusercontent.com/APIs-guru/openapi-directory/master/APIs/kubernetes.io/v1.10.0/swagger.yaml"
ITERATIONS_NUMBER = 10

SCHEMA = requests.get(SCHEMA_URL).json()
INSTANCE = yaml.load(requests.get(INSTANCE_URL).content, Loader=Loader)

validate = fastjsonschema.compile(SCHEMA)

for _ in range(ITERATIONS_NUMBER):
    start = time.time()
    validate(INSTANCE)
    print(f"Iteration time: {time.time() - start}")
Output:
Iteration time: 0.1041560173034668
Iteration time: 0.12305545806884766
Iteration time: 0.16190171241760254
Iteration time: 0.2381150722503662
Iteration time: 0.438570499420166
Iteration time: 0.8084230422973633
Iteration time: 1.4931752681732178
Iteration time: 2.8855996131896973
Iteration time: 5.7769176959991455
Iteration time: 11.246583461761475
Here is the memory usage plotted with memory-profiler==0.58.0
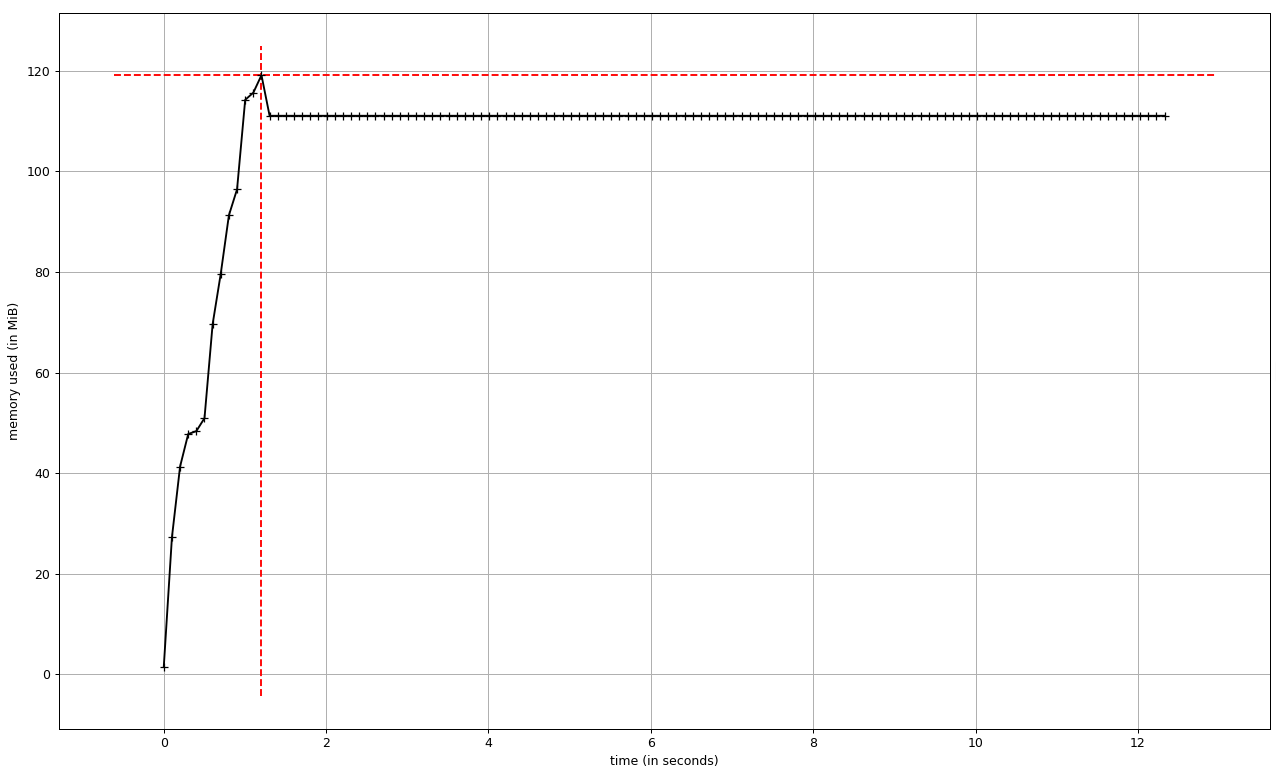
For comparison, this is the memory usage of jsonschema==3.2.0:
Code is almost the same (the validator is compiled):
import jsonschema
import requests
import yaml

try:
    from yaml import CSafeLoader as Loader
except ImportError:
    from yaml import SafeLoader as Loader

SCHEMA_URL = "https://raw.githubusercontent.com/OAI/OpenAPI-Specification/master/schemas/v2.0/schema.json"
INSTANCE_URL = "https://raw.githubusercontent.com/APIs-guru/openapi-directory/master/APIs/kubernetes.io/v1.10.0/swagger.yaml"
ITERATIONS_NUMBER = 10

SCHEMA = requests.get(SCHEMA_URL).json()
INSTANCE = yaml.load(requests.get(INSTANCE_URL).content, Loader=Loader)

validate = jsonschema.validators.validator_for(SCHEMA)(SCHEMA)

for _ in range(ITERATIONS_NUMBER):
    validate.validate(INSTANCE)
Unfortunately, I didn’t track down what exactly causes the leak (my assumption is that validating the same instance should not linearly increase the memory usage)
Cheers
Issue Analytics
- State:

- Created 3 years ago
- Comments:7 (4 by maintainers)
 Top Related StackOverflow Question
 Troubleshoot Live Code
 Top Related Reddit Thread
 Top Related Hackernoon Post
 Top Related Tweet
 Top Related Dev.to Post
 Top Related Hashnode Post
I just pushed new version with
use_defaultoption. Default is stillTrueto be compatible, but you can fall back to set it toFalse.For now, you could recursively iterate the schema and remove all defaults keys from third party schema. Will make for #65 higher priority.