
Lightrun Answers was designed to reduce the constant googling that comes with debugging 3rd party libraries. It collects links to all the places you might be looking at while hunting down a tough bug.
And, if you’re still stuck at the end, we’re happy to hop on a call to see how we can help out.
Significant memory leak in version 2.9.0
See original GitHub issueWhen we try to upgrade from version 2.8.8 to version 2.9.0 our medium-sized multi-module Maven build fails with java.lang.OutOfMemoryError: Java heap space. Based on investigation using JFR/JMC and git bisect the issue appears to be introduced in these two commits:
- 080040703de9ee9a6a842e783be66a3a21ff24bb (#1235).
- 2b9a79ce359d852c5c697792fd3f9f17b3c8efeb (#1249).
Some numbers:
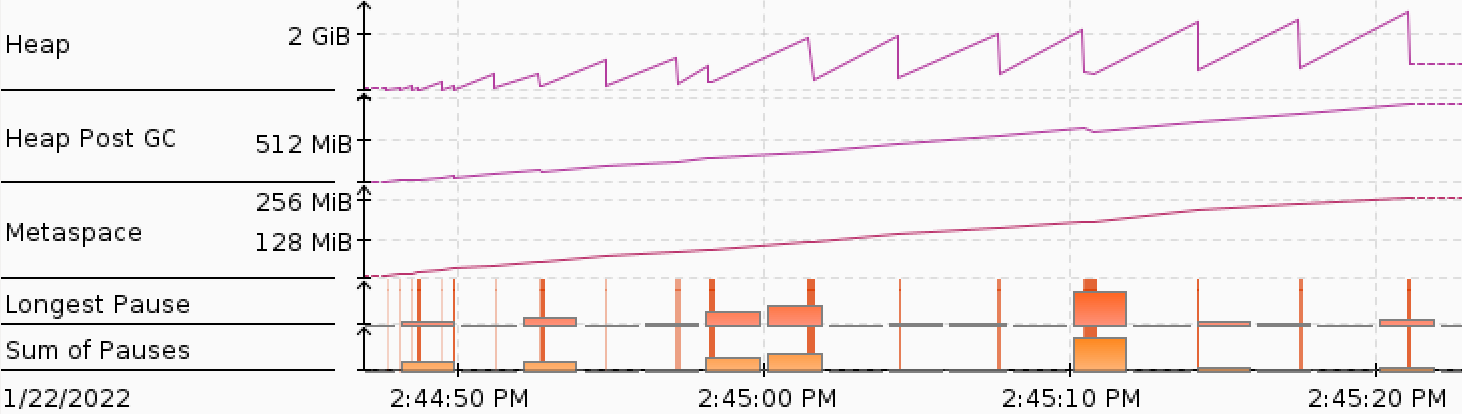
- After the first commit meta space usage increases from ~115MB to ~260MB, while heap memory usage increases from ~270MB to ~620MB.
- After the second commit heap memory usage further increases to ~960MB.
(I performed many runs. There is little variance in these runs; on the order of ~5-10MB. After the first commit the classical GC zig-zag/sawtooth pattern all but disappears, hinting at a classical memory leak. See also the screenshots at the bottom of this message.)
JMC’s Memory -> Live Objects view hints at the thread local state of StaticEnvironment being retained. Based on some subsequent debugging the following issues appear to contribute:
AbstractGenerator#initcallsStaticEnvironment.preInit, but ifAbstractGenerator#processis not subsequently called thenStaticEnvironment#shutdownwon’t be invoked.- Although we don’t fork, it appears that each invocation of the
maven-compiler-pluginloads a newStaticEnvironmentclass, which means that for each invocation a new thread-localEnvironmentStateis created. - These two things combined appear to cause a significant memory leak, (I think) especially due to the accumulation of
ProcessingEnvironments.
I don’t yet see a quick fix. Unfortunately javax.annotation.processing.Processor does not provide a “cleanup” or “shutdown” method. The proper fix likely involves getting rid of all this static and thread-local state (as also hinted at here), but that seems like a large task…
That said, as-is version 2.9.0 of Immutables appears to be unusable for us. The build on which I reproduced this has 52 pom.xml files with 90 maven-compiler-plugin invocations (compile and testCompile combined), but we also have a few much-larger builds with 250+ pom.xml files.
Below three screenshots from JMC’s JVM Internals -> Garbage Collections view. The first build uses e31f58d44612f2211679a07229a96d9ddf62aa7a (i.e. the parent of the first problematic commit), the second uses 080040703de9ee9a6a842e783be66a3a21ff24bb, while the third uses 2b9a79ce359d852c5c697792fd3f9f17b3c8efeb. Note the Heap Post GC and Metaspace graphs.


Issue Analytics
- State:

- Created 2 years ago
- Reactions:2
- Comments:18 (15 by maintainers)
 Top Related StackOverflow Question
 Troubleshoot Live Code
 Top Related Reddit Thread
 Top Related Hackernoon Post
 Top Related Tweet
 Top Related Dev.to Post
 Top Related Hashnode Post
That’s makes sense, thank you for more context/explanation. This change is pending the release for some time now, I just got overwhelmed with other stuff, but also I need to update gpg keys for release and this became a sort of yak shaving. I still hope to just sit and make the release asap.
Hello folks. First, thanks a lot for all the research you have been doing. I ran into a similar situation and it was really easy to solve given that you already had a patch available.
@elucash I may be able to provide some context here. We are building a large Maven project composed of 450 modules. And I noticed a pretty bad classloader leak (>5.5 GB usage in the Metaspace).
I think what is happening is that every time a module is built, a new
ClassLoaderis instantiated. Each time, theorg.immutables:valueannotation processor is loaded in a separate class loader. And since it stores itsStaticEnvironmentin aThreadLocal, with a strong reference, the environment is never deleted. Thus, the class definition stays reachable, and so does the class loader itself.After ~20 modules compiled with the annotation processor, I ended up with as many leaked class loaders (including all their static variables, leading to a memory leak in the heap as well).
See this screenshot, which shows how
ThreadLocalshold references to multipleStaticEnvironments, and therefore to their class loaders.I cloned this project and built it locally from
master. I can confirm that with the fix proposed by @Stephan202, the memory leak is gone.Would it be possible to cut a release with this change please?