
Lightrun Answers was designed to reduce the constant googling that comes with debugging 3rd party libraries. It collects links to all the places you might be looking at while hunting down a tough bug.
And, if you’re still stuck at the end, we’re happy to hop on a call to see how we can help out.
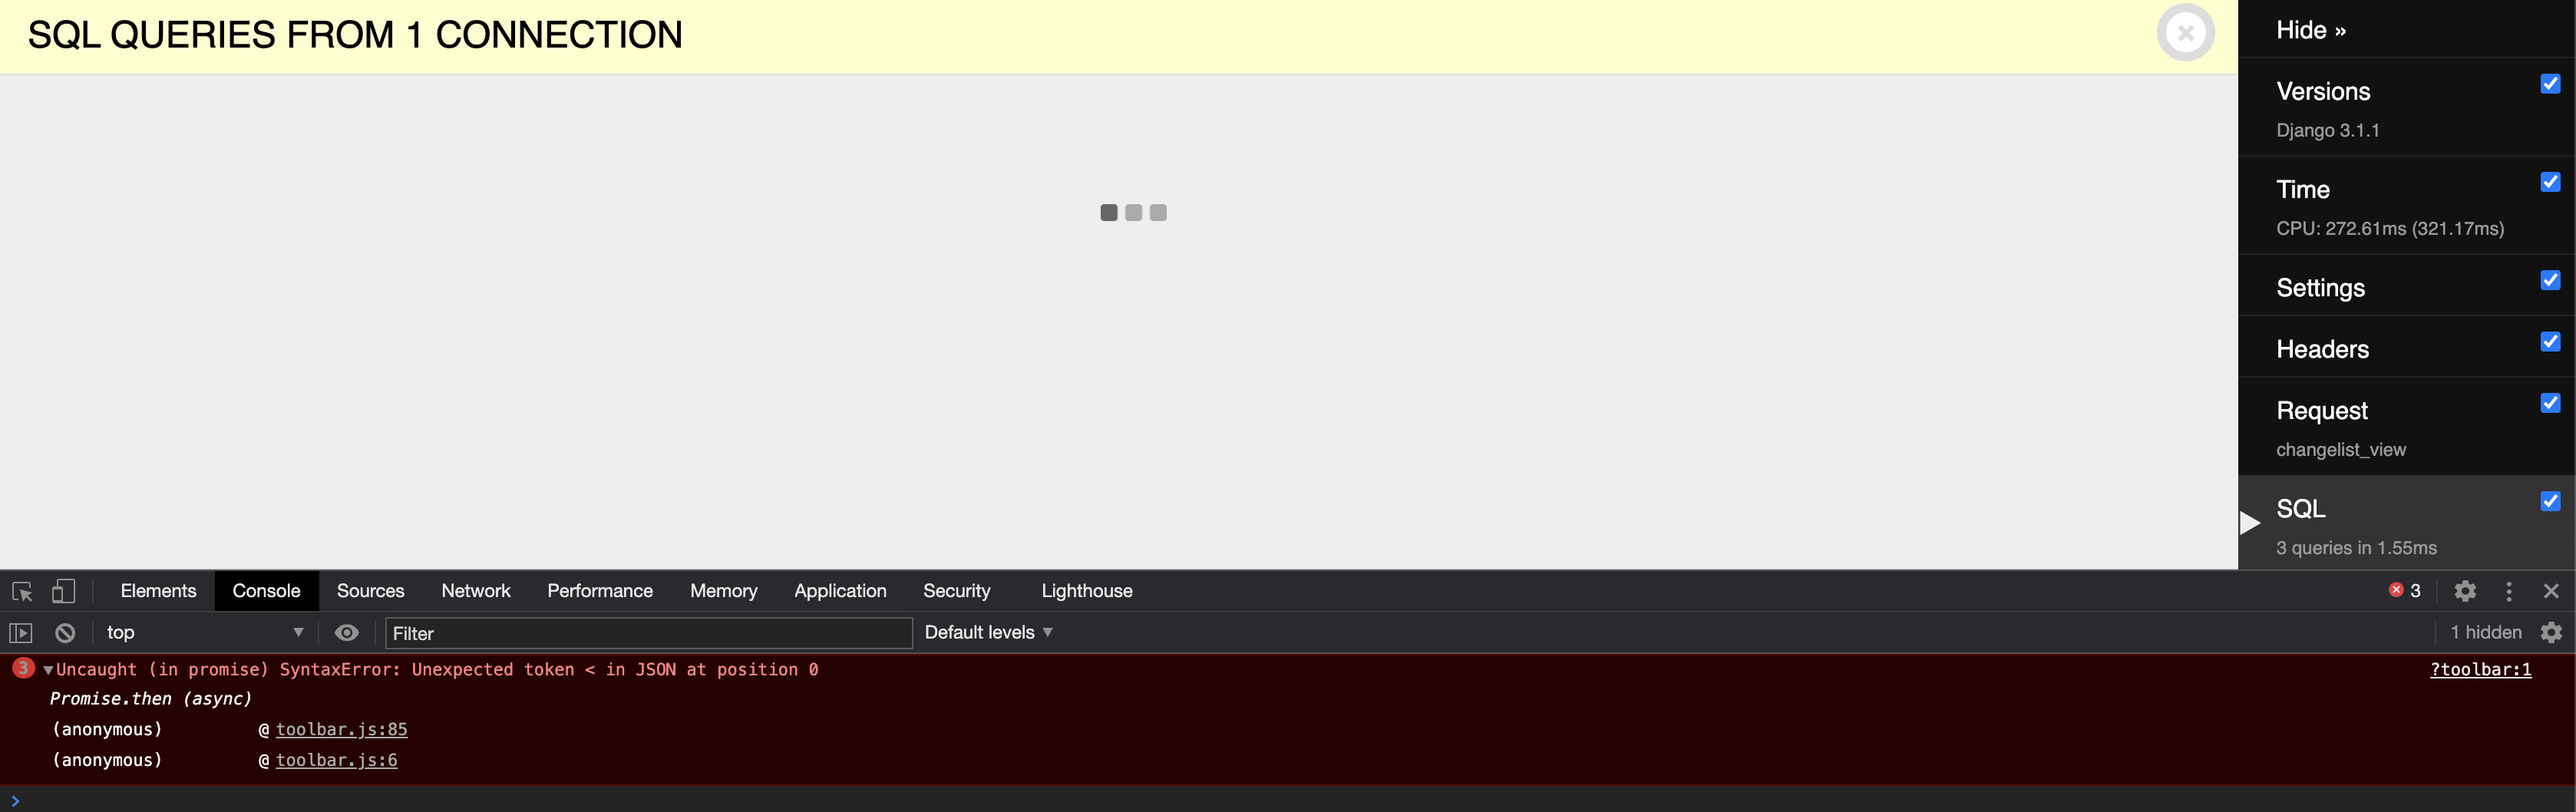
Unexpected token < in JSON when trying to load a panel
See original GitHub issueMigrating from django-debug-toolbar from 2.2 to 3.1.1 Django version: 3.1.1
When clicking onto a panel, the loading indicator runs forever due to an error in a JS promise.
The issue seems to be attempting to parse an HTML document as JSON.
I have verified that the latest mime-support package is installed on my Ubuntu container per https://django-debug-toolbar.readthedocs.io/en/latest/installation.html#troubleshooting and the other prerequisites should be complete.
https://github.com/jazzband/django-debug-toolbar/blob/master/debug_toolbar/static/debug_toolbar/js/toolbar.js#L43
The request is to /__debug__/render_panel/?store_id=...&panel_id=SQLPanel
The failing JSON parse is: https://github.com/jazzband/django-debug-toolbar/blob/master/debug_toolbar/static/debug_toolbar/js/utils.js#L42
Setting a breakpoint at return response.json(); and manually getting the value in the console:
response.text().then(function (text) {
  console.log(text);
});
I do get an HTML document beginning like this, which appears to be a JSON document rendered in an HTML page:
<html><body><pre>{
  "content": "\n<ul>\n  \n    <li>\n      <strong><span class=\"djdt-color\" style=\"background-color:rgb(256, 0, 0)\"></span> default</strong>\n      0.94 ms (3 queries\n      \n        including <abbr title=\"Similar queries are queries with the same SQL, but potentially different parameters.\">2 similar</abbr>\n        \n          and <abbr title=\"Duplicate queries are identical to each other: they execute exactly the same SQL and parameters.\">2 duplicates</abbr>\n        \n      )\n    </li>\n  \n</ul>\n\n\n  <table>\n    <thead>\n      <tr>\n        <th></th>\n        <th class=\"djdt-query\" colspan=\"2\">Query</th>\n        <th class=\"djdt-timeline\">Timeline</th>\n        <th class=\"djdt-time\">Time (ms)</th>\n
The opening left bracket from <html> is what leads to the error Uncaught (in promise) SyntaxError: Unexpected token < in JSON at position 0 from what I gather.
Issue Analytics
- State:

- Created 3 years ago
- Comments:6 (3 by maintainers)
 Top Related StackOverflow Question
 Troubleshoot Live Code
 Top Related Reddit Thread
 Top Related Hackernoon Post
 Top Related Tweet
 Top Related Dev.to Post
 Top Related Hashnode Post
No problem, I’m glad you were able to figure it out!
Can you see what the response type is in the network panel? Seems like the toolbar’s returning it as a HTML response rather than a JSON response.