
Lightrun Answers was designed to reduce the constant googling that comes with debugging 3rd party libraries. It collects links to all the places you might be looking at while hunting down a tough bug.
And, if you’re still stuck at the end, we’re happy to hop on a call to see how we can help out.
Customising each bar drawn within a chart
See original GitHub issueWhat is the problem?
I’d like to visually round off the ends of a StackedBarChart element’s bars – both foreground data and background guides – like so:
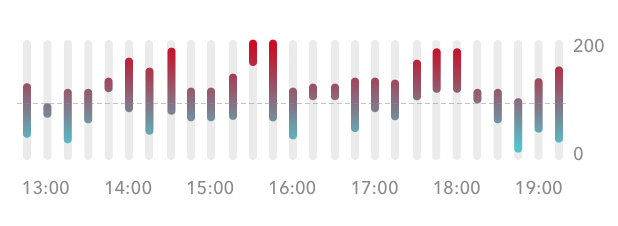 I’d also like to apply a gradient effect to each bar, as per the illustration above.
However, having read through the documentation and looked at the examples, I haven’t discovered if customisation for individual bar chart elements is possible in this specific way.
Can someone tell me how to apply these customisations to each bar please?
Issue Analytics
- State:

- Created 5 years ago
- Reactions:1
- Comments:7 (3 by maintainers)
 Top Related StackOverflow Question
 Troubleshoot Live Code
 Top Related Reddit Thread
 Top Related Hackernoon Post
 Top Related Tweet
 Top Related Dev.to Post
 Top Related Hashnode Post
Great, thanks for the input. I’ll keep this issue open to remind me about the borderRadius for BarChart
No worries, @JesperLekland – thanks again for your help. I was thinking it would need to be an interpolated, per-bar gradient; if I produce anything useful, I’ll share it here.