
Stuck on an issue?
Lightrun Answers was designed to reduce the constant googling that comes with debugging 3rd party libraries. It collects links to all the places you might be looking at while hunting down a tough bug.
And, if you’re still stuck at the end, we’re happy to hop on a call to see how we can help out.
How to change x-axis and y-axis values
See original GitHub issueWhat is the problem?
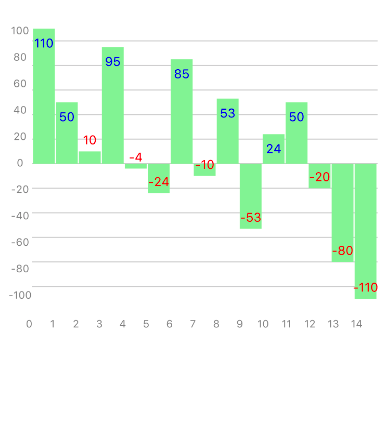
Hi, i am using this module it’s working fine. But my question is how to change the x-axis values and y-axis values in Bar-Chart.
Initially takes x-axis values are 0,1,2,3,4------
Initially takes y-axis values are -80,-60,-40,-20,0,20,40-----
What platform?
- iOS
- Android React Native version: 0.56.1
Code to reproduce
import React from 'react'
import { Grid, LineChart, XAxis, YAxis, BarChart } from 'react-native-svg-charts'
import { View, Text as RNText } from 'react-native'
import { Text } from 'react-native-svg'
class XYAxisBarChart extends React.PureComponent {
  render() {
    const data = [110, 50, 10, 95, -4, -24, 85, -10, 53, -53, 24, 50, -20, -80, -110]

    const axesSvg = { fontSize: 10, fill: 'grey' }
    const verticalContentInset = { top: 10, bottom: 10 }
    const xAxisHeight = 30
    const CUT_OFF = 20

    const Labels = ({ x, y, bandwidth, data }) =>
      data.map((value, index) => {

        return (
          <Text
            key={index}
            x={x(index) + bandwidth / 2}
            y={value < CUT_OFF ? y(value) - 10 : y(value) + 15}
            fontSize={12}
            fill={value >= CUT_OFF ? 'blue' : 'red'}
            alignmentBaseline={'middle'}
            textAnchor={'middle'}
          >
            {value}
          </Text>
        )
      })


    return (
      <View style={{ flex: 1, padding: 10 }}>
        <View style={{ height: 300, flexDirection: 'row' }}>
          <YAxis data={data} style={{ marginBottom: 0 }} contentInset={verticalContentInset} svg={axesSvg} />
          <View style={{ flex: 1 }}>
            <BarChart
              style={{ flex: 1 }}
              data={data}
              contentInset={{ top: 20, bottom: 20 }}
              svg={{
                fill: 'lightgreen'
              }}
            >
              <Grid />
              <Labels />
            </BarChart>
          </View>
        </View>
        <XAxis style={{ marginHorizontal: -10, height: 30 }} data={data} formatLabel={(value, index) => index} svg={axesSvg} contentInset={{ left: 30, right: 30 }} />
      </View>
    )
  }
}

export default XYAxisBarChart
Here is my screenshot:-
Issue Analytics
- State:

- Created 5 years ago
- Comments:6
 Top Results From Across the Web
Change axis labels in a chart - Microsoft Support
Right-click the value axis labels you want to format. · Click Format Axis. · In the Format Axis pane, click Number. · Choose...
Read more >To Change X-Axis and Y-Axis Values (Sun Management ...
To modify the values to be used for the X-axis, choose Axes from the Edit menu in the Graphing window. The Axes Editing...
Read more >How to Change Axis Values in Excel | Excelchat - Got It AI
In Select Data chart option we can change axis values or switch x and y axis If we want to edit axis or...
Read more >How to Change the X-Axis in Excel - Alphr
Open the Excel file with the chart you want to adjust. · Right-click the X-axis in the chart you want to change. ·...
Read more >How to Change Axis Scales in Excel Plots (With Examples)
To change the scale of the x-axis, simply right click on any of the values on the x-axis. In the dropdown menu that...
Read more > Top Related Medium Post
No results found
 Top Related StackOverflow Question
No results found
 Troubleshoot Live Code
Lightrun enables developers to add logs, metrics and snapshots to live code - no restarts or redeploys required.
Start Free Top Related Reddit Thread
No results found
 Top Related Hackernoon Post
No results found
 Top Related Tweet
No results found
 Top Related Dev.to Post
No results found
 Top Related Hashnode Post
No results found
To Change X and Y axis value use object to store the data:
import React from ‘react’; import {SafeAreaView, StyleSheet, ScrollView, View} from ‘react-native’; import {BarChart, Grid, XAxis, YAxis} from ‘react-native-svg-charts’; import * as scale from ‘d3-scale’; import {Text} from ‘react-native-svg’; class App extends React.Component { render() { const data = [ { value: 50, labelX: ‘A’, labelY: ‘One’, }, { value: 10, labelX: ‘B’, labelY: ‘Two’, }, { value: 40, labelX: ‘C’, labelY: ‘Three’, }, { value: 95, labelX: ‘D’, labelY: ‘Four’, }, { value: 85, labelX: ‘E’, labelY: ‘Five’, }, ];
} }
const styles = StyleSheet.create({ scrollView: { backgroundColor: ‘#f9f9f9’, padding: 10, }, });
export default App;
can this is use for area chart also ???