
Stuck on an issue?
Lightrun Answers was designed to reduce the constant googling that comes with debugging 3rd party libraries. It collects links to all the places you might be looking at while hunting down a tough bug.
And, if you’re still stuck at the end, we’re happy to hop on a call to see how we can help out.
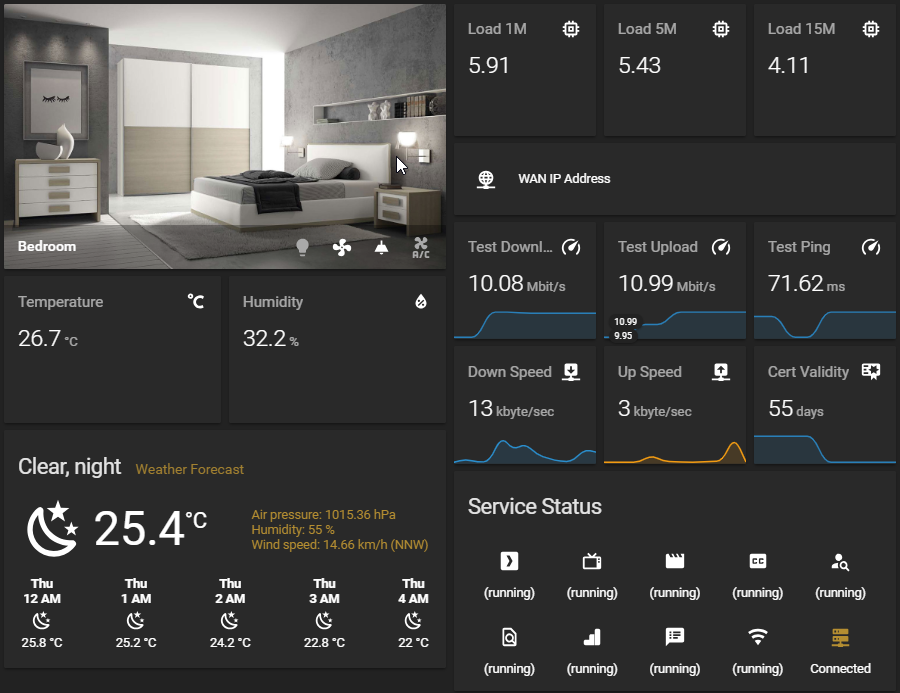
Unable to see graphs after 0.2.3
See original GitHub issueI am unable to see the graphs for the Load and the Temp / Humidity Sensor after upgrade to 0.2.3. My configurations are below:
- entities:
- light.ceiling_bulb
- fan.ceiling_fan
- light.ceiling_light
- switch.ac
image: /local/bedroom.jpg
title: Bedroom
type: picture-glance
- cards:
- cards:
- entities:
- sensor.temperature
font_size: 75
line_color_threshold:
- color: '#2a8fce'
value: 1
- color: '#33ce2b'
value: 10
- color: '#f39c12'
value: 24
- color: '#d35400'
value: 28
- color: '#c0392b'
value: 30
line_width: 5
location_icon: left
location_state: center
show:
extrema: true
points: false
type: 'custom:mini-graph-card'
- entities:
- sensor.humidity
font_size: 75
line_color_threshold:
- color: '#33ce2b'
value: 1
- color: '#f39c12'
value: 30
- color: '#d35400'
value: 35
- color: '#c0392b'
value: 40
line_width: 5
location_icon: left
location_state: center
show:
extrema: true
points: false
type: 'custom:mini-graph-card'
type: horizontal-stack
type: horizontal-stack
- entity: weather.weather_forecast
type: weather-forecast
- artwork: cover
entity: media_player.mokshs_tv
hide_power: true
icon: 'mdi:cast'
max_volume: 30
power_color: true
scroll_info: true
show_progress: true
show_source: true
type: 'custom:mini-media-player'
type: vertical-stack
`cards:
- cards:
- cards:
- cards:
- entities:
- sensor.load_1m
font_size: 75
line_color_threshold:
- color: '#2a8fce'
value: 0.01
- color: '#f39c12'
value: 2
- color: '#d35400'
value: 3
- color: '#c0392b'
value: 4
line_width: 5
name: Load 1M
show:
extrema: true
points: false
type: 'custom:mini-graph-card'
- entities:
- sensor.load_5m
font_size: 75
line_color_threshold:
- color: '#2a8fce'
value: 0.01
- color: '#f39c12'
value: 2
- color: '#d35400'
value: 3
- color: '#c0392b'
value: 4
line_width: 5
name: Load 5M
show:
extrema: true
points: false
type: 'custom:mini-graph-card'
- entities:
- sensor.load_15m
font_size: 75
line_color_threshold:
- color: '#2a8fce'
value: 0.01
- color: '#f39c12'
value: 2
- color: '#d35400'
value: 3
- color: '#c0392b'
value: 4
line_width: 5
name: Load 15M
show:
extrema: true
points: false
type: 'custom:mini-graph-card'
type: horizontal-stack
type: horizontal-stack
- entities:
- entity: sensor.wan_ip_address
icon: 'mdi:wan'
show_header_toggle: false
type: entities
- cards:
- entities:
- sensor.speedtest_download
font_size: 75
line_color_threshold:
- color: '#c0392b'
value: 0
- color: '#d35400'
value: 4
- color: '#f39c12'
value: 6
- color: '#2a8fce'
value: 8
line_width: 5
name: Test Download
show:
points: false
type: 'custom:mini-graph-card'
- entities:
- sensor.speedtest_upload
font_size: 75
line_color_threshold:
- color: '#c0392b'
value: 0
- color: '#d35400'
value: 4
- color: '#f39c12'
value: 6
- color: '#2a8fce'
value: 8
line_width: 5
name: Test Upload
show:
points: false
type: 'custom:mini-graph-card'
- entities:
- sensor.speedtest_ping
font_size: 75
line_color_threshold:
- color: '#2a8fce'
value: 0
- color: '#f39c12'
value: 60
- color: '#d35400'
value: 80
- color: '#c0392b'
value: 100
line_width: 5
name: Test Ping
show:
points: false
type: 'custom:mini-graph-card'
type: horizontal-stack
- cards:
- decimals: 0
entities:
- sensor.freebsd_router_kbytesec_received
font_size: 75
line_color: '#2a8fce'
line_width: 5
name: Down Speed
show:
points: false
type: 'custom:mini-graph-card'
- decimals: 0
entities:
- sensor.freebsd_router_kbytesec_sent
font_size: 75
line_color: '#f39c12'
line_width: 5
name: Up Speed
show:
points: false
type: 'custom:mini-graph-card'
- entities:
- sensor.moksh_s_webserver
font_size: 75
line_color_threshold:
- color: '#c0392b'
value: 30
- color: '#d35400'
value: 60
- color: '#2a8fce'
value: 90
line_width: 5
name: Cert Validity
show:
points: false
type: 'custom:mini-graph-card'
type: horizontal-stack
- entities:
- entity: sensor.plex_server
hold_action:
action: call-service
service: script.restart_pms
- entity: sensor.sonarr
hold_action:
action: call-service
service: script.restart_sonarr_service
- entity: sensor.radarr
hold_action:
action: call-service
service: script.restart_radarr_service
- entity: sensor.bazarr
hold_action:
action: call-service
service: script.restart_bazarr_service
- entity: sensor.jackett
hold_action:
action: call-service
service: script.restart_jackett_service
- entity: sensor.ombi
hold_action:
action: call-service
service: script.restart_ombi_service
- entity: sensor.tautulli
hold_action:
action: call-service
service: script.restart_tautulli_service
- entity: sensor.mosquitto
hold_action:
action: call-service
service: script.restart_mosquitto_service
- entity: sensor.unifi
hold_action:
action: call-service
service: script.restart_unifi_service
- entity: binary_sensor.home_server
show_name: false
show_state: true
title: Service Status
type: glance
type: vertical-stack
type: vertical-stack
Screenshot for reference
Issue Analytics
- State:

- Created 5 years ago
- Comments:10 (6 by maintainers)
 Top Results From Across the Web
Cannot view graphs and run pipelines in Kubeflow 1.0.2 #4254
After that, if I go to the Kubeflow UI -> Pipelines and click on my imported pipelines, graphs and YAML's tab are empty....
Read more >Using Chart.js - The X axis labels are not all showing
The reason you can't see all your x-axis labels is that the width's are too thin. You can fix this by either expanding...
Read more >How to change spacing between axes values in graphs on ...
I am needing to draw line graphs to display figures for Advanced Higher (Scottish A Level Equivalent) Chemistry project using Excel 2007.
Read more >How to read a log scale: The chart that can't start at zero
This is part 2 of a series by the data visualization tool Datawrapper that explains log scales. Visit part 1 or part 3....
Read more >Graph an equation, inequality or a system. Example - QuickMath
Graph equations, system of equations or quadratic equations with our free step-by-step algebra calculator.
Read more > Top Related Medium Post
No results found
 Top Related StackOverflow Question
No results found
 Troubleshoot Live Code
Lightrun enables developers to add logs, metrics and snapshots to live code - no restarts or redeploys required.
Start Free Top Related Reddit Thread
No results found
 Top Related Hackernoon Post
No results found
 Top Related Tweet
No results found
 Top Related Dev.to Post
No results found
 Top Related Hashnode Post
No results found
@kalkih doing this seems to have fixed the issues.
Thanks mate.
Perfect, thanks, closing this since it’s resolved. If you have more issues or ideas, don’t hesitate to open another one.