
Lightrun Answers was designed to reduce the constant googling that comes with debugging 3rd party libraries. It collects links to all the places you might be looking at while hunting down a tough bug.
And, if you’re still stuck at the end, we’re happy to hop on a call to see how we can help out.
Enable drill by dimension on charts
See original GitHub issueDescription
A common flow that users take is:
- Click a chart element to get the context menu
- Click “show underlying values”
- Then “explore from here” - which launches a blank explore with the correct filters applied from the chart segment
- And then in the sidebar, change the dimensions to explore that segment by a different dimension
We could make this journey substantially shorter by allowing the user to choose a dimension directly from the context menu. The new flow:
- Click a chart element to get the context menu
- Choose “Drill by…” and show a list of available dimensions for that chart
- Click a dimension (e.g. country)
- Launch a new explore (in a new tab) with the correct filters AND the original metrics from the chart and selected dimensions.
Example
From demo.lightdash.com
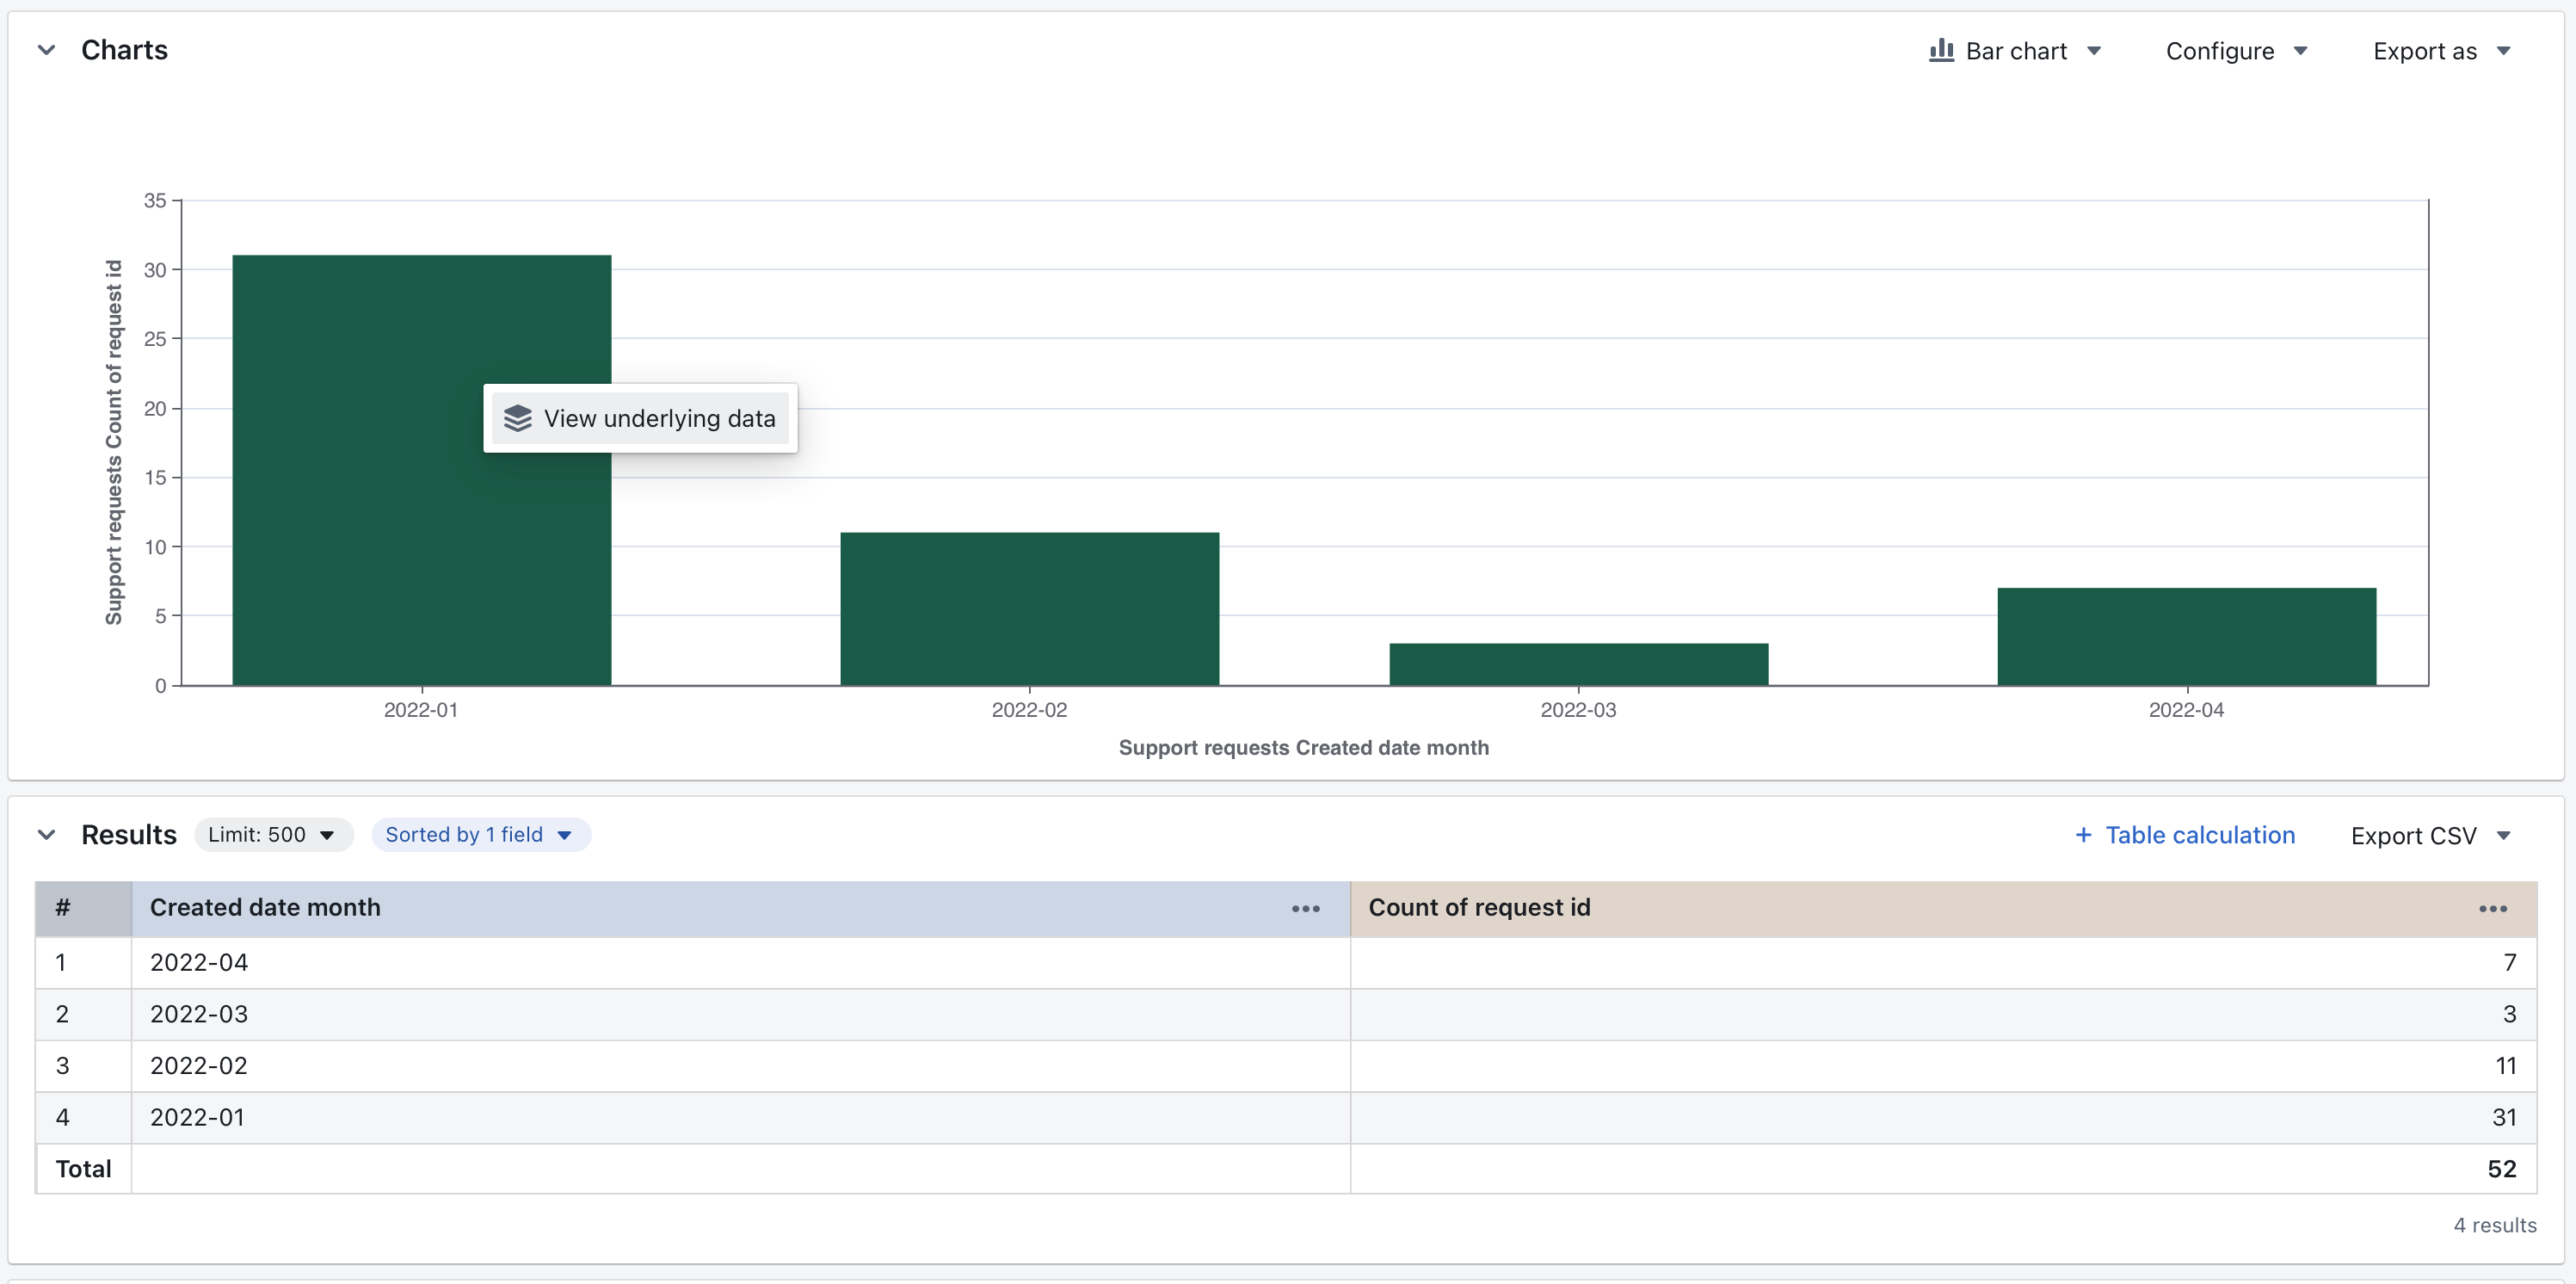
Exploring: support requests (each row is a single support request)
Starting chart shows the number of requests created per month
- Metric: total requests
- Dimension: created date month
Link: https://lightdash-demo-thyme.onrender.com/share/-Vp7tr3UkBOdTmCoGtCJu
The chart has 4 months of data. And 2022-01 is a big outlier (so many requests!!). So I click on the bar and see “view underlying data”. I would also like to see Drill By…
Next I click drill by “reason” - “reason” is a category we attach to support tickets. So I’m saying “I want to further drill that bar by reason”.
This would launch me into a new chart showing:
- Metric: total requests (same metric)
- Dimension: reason (the selected drill field)
- Filter: created date month = 2022-01 (the selected segment)
Link: https://lightdash-demo-thyme.onrender.com/share/NNC-IQ4tx-T0ocDvCE-BT
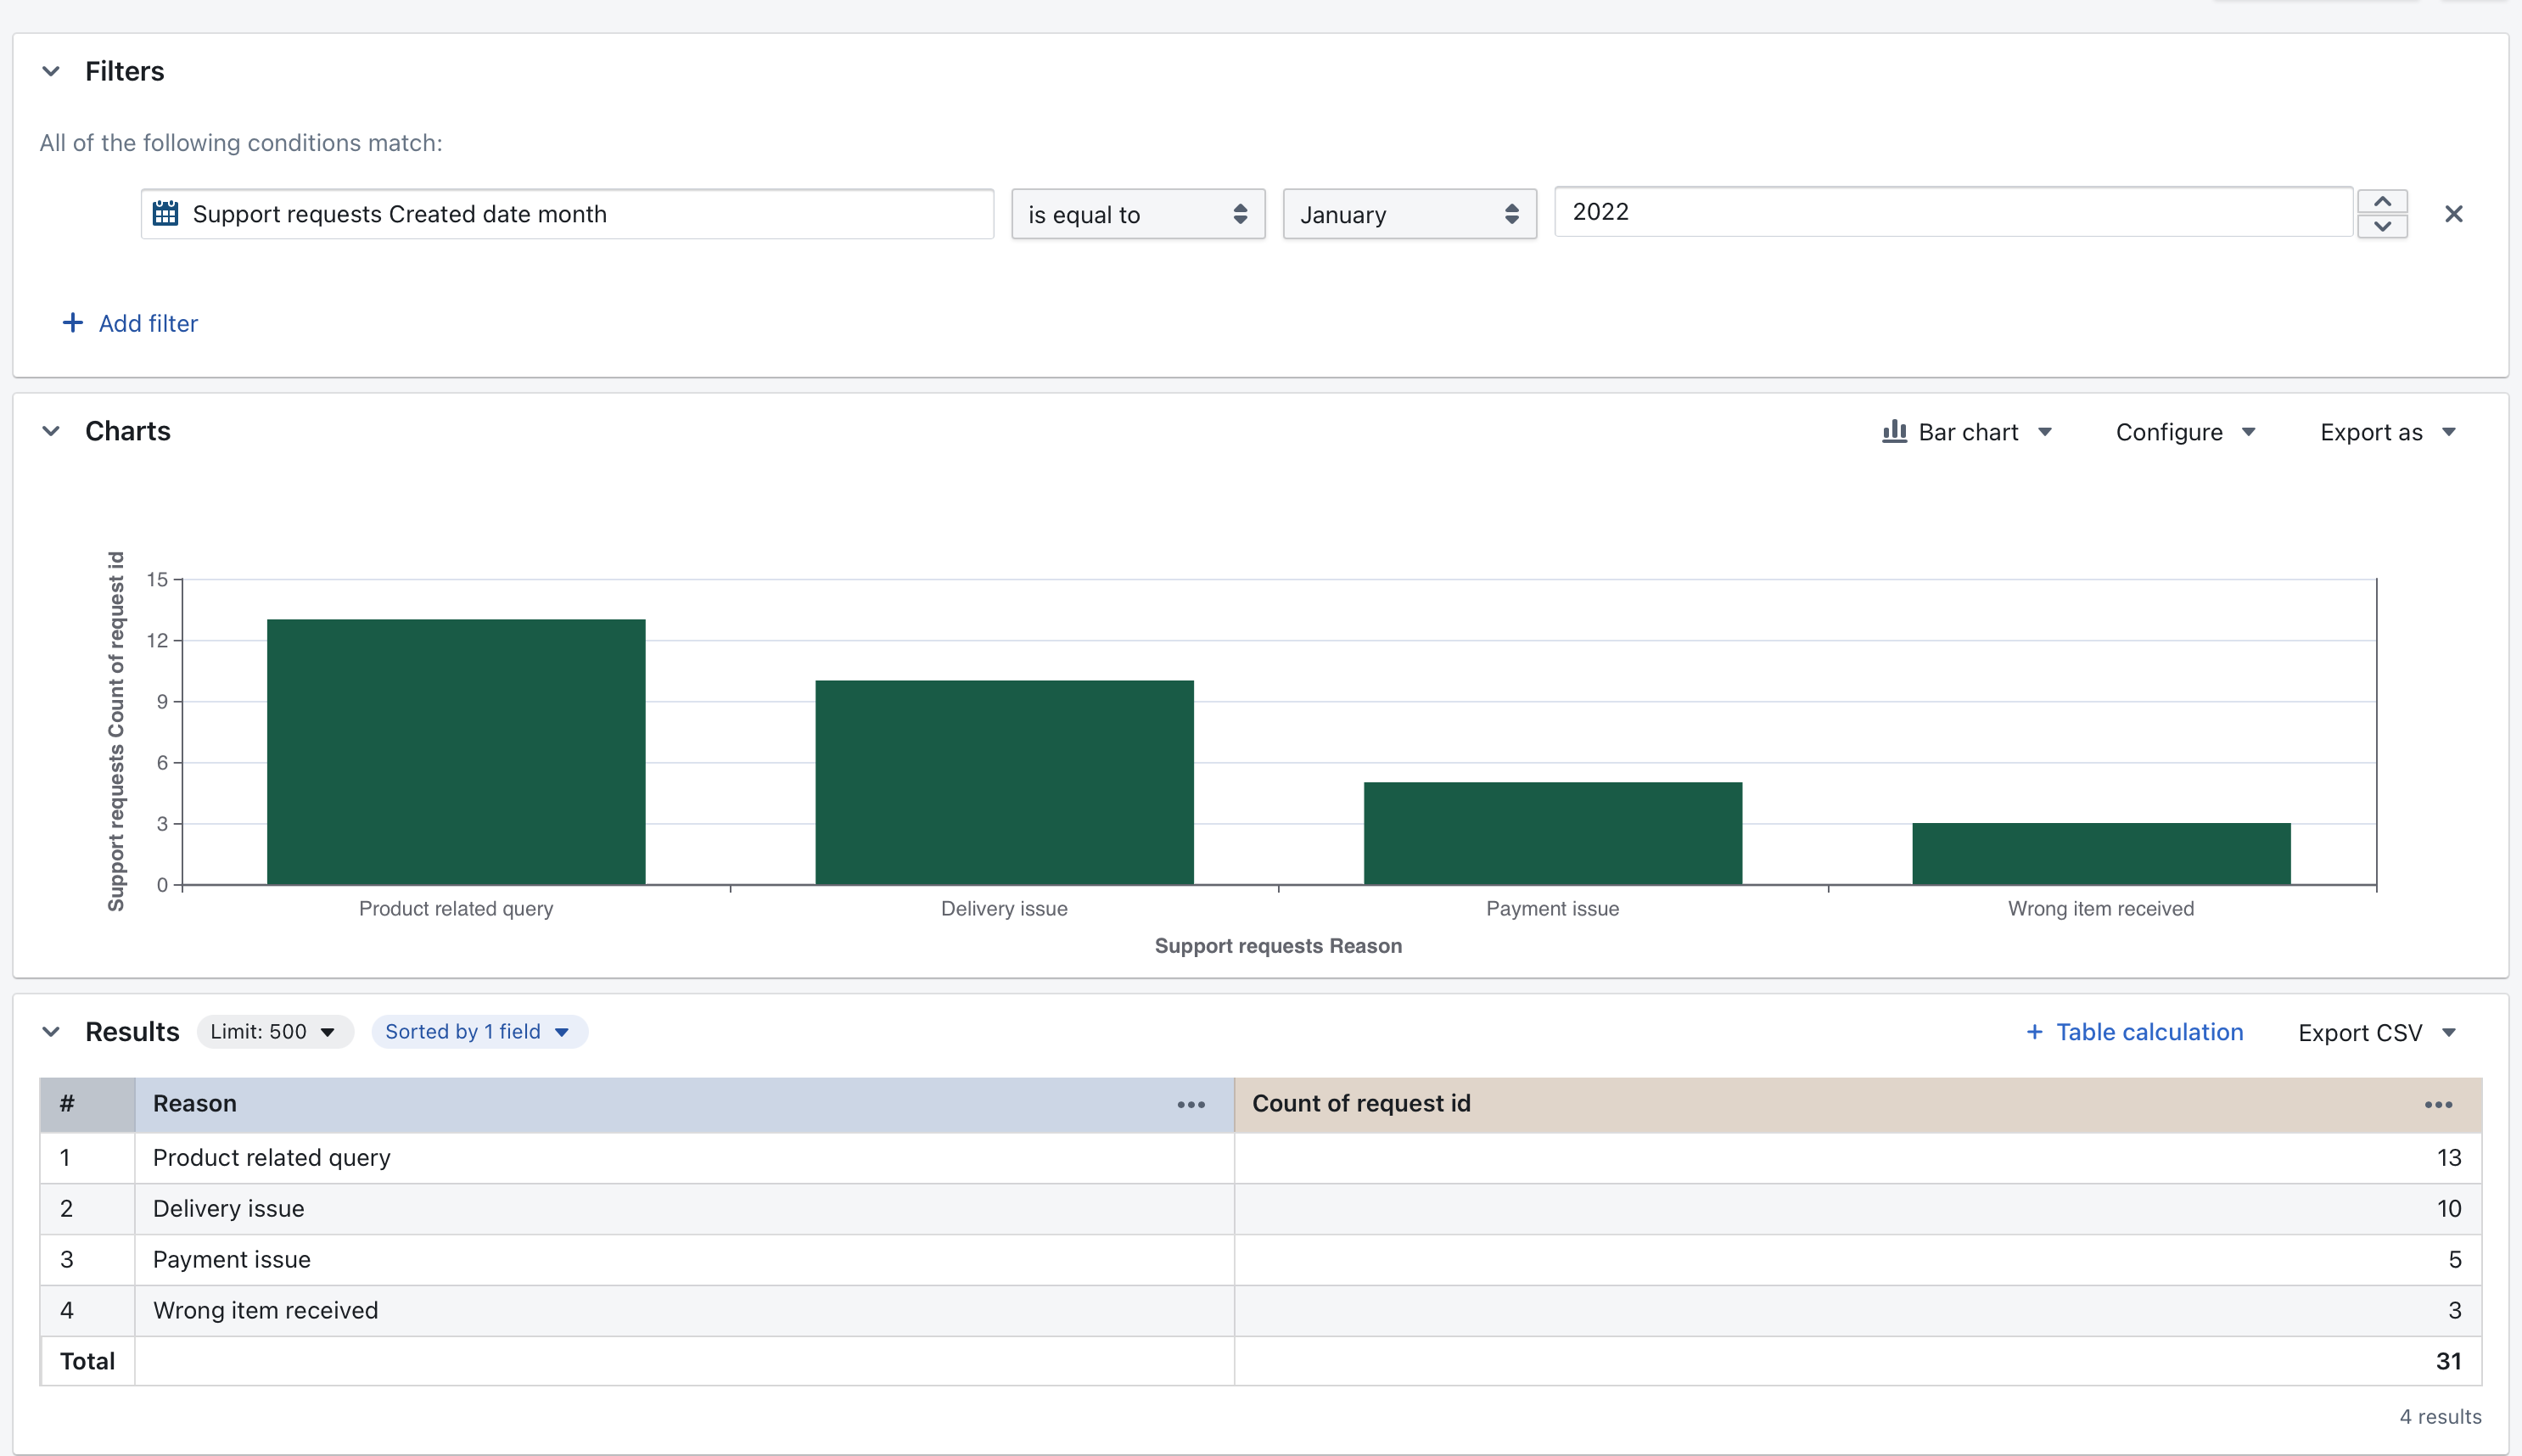
Now I can see that there were many product related queries and delivery issues during that month. That might explain the spike in the bar!
Implementation
This is very similar to the existing implementation for view underlying values, where we’re basically constructing a new explore.
See this file for logic: https://github.com/lightdash/lightdash/blob/main/packages/frontend/src/components/UnderlyingData/UnderlyingDataModalContent.tsx#L42-L42
This logic should live in common along with other functions that generate explores / metric queries (e.g. applying dashboard filters to a query, getting query for underlying data, generating drill by queries etc.).
A summary of the acceptance criteria
- Any chart element that encodes a single metric will now have the option to
drill byin the context menu. - You need to select a dimension to
drill by - You can select a dimension from any of the table’s available dimensions (both the primary model and the joined models).
- There’s a way to search for which dimension you want to add (similar to the filter selection component?)
-
drill bylaunches a new explore (in a new tab) with:- the same filters as the original chart
- an added filter for the x-axis value from the original chart value you clicked
drill byon - if your chart was grouped, then there’s an added filter for the group the value belonged to (e.g. if I had grouped my chart by
cloudandself-hosted, but clickeddrill byon theself-hostedpart of the bar, then we’d add aself-hostedfilter to the new chart) - the same y-axis values as the original chart
- the x-axis value now becomes the dimension that you selected to
drill by
- see an example of how this would work from a value in the results table here
- The chart that is opened from a
drill byis just the default chart configurations (we don’t keep any of the config that was changed from the original chart). - You can drill into any chart element that encodes a single metric. So points on a line, bars, bar segments, big numbers, value in a table. As long as the value clicked encodes a single metric
- Things you can’t drill into:
- Point on a scatter chart of a dimension vs dimension
- Point on a scatter chart of a metric vs metric
- Value in a table that is a dimension
- Any point that’s a table calculation
Issue Analytics
- State:

- Created 10 months ago
- Comments:8 (4 by maintainers)
 Top Related StackOverflow Question
 Troubleshoot Live Code
 Top Related Reddit Thread
 Top Related Hackernoon Post
 Top Related Tweet
 Top Related Dev.to Post
 Top Related Hashnode Post
Ah I missed out groups! They would be become part of the filters just like in “show underlying values” so the result is always an ungrouped chart.
Good questions!!
You can drill into any chart element that encodes a single metric. So points on a line, bars, bar segments, big numbers, value in a table. As long as the value clicked encodes a single metric
Things you can’t drill into:
v1 I would use a blank explore with the default chart