
Stuck on an issue?
Lightrun Answers was designed to reduce the constant googling that comes with debugging 3rd party libraries. It collects links to all the places you might be looking at while hunting down a tough bug.
And, if you’re still stuck at the end, we’re happy to hop on a call to see how we can help out.
Uptime Calculation using Push Monitor is Wrong
See original GitHub issue⚠️ Please verify that this bug has NOT been raised before.
- I checked and didn’t find similar issue
🛡️ Security Policy
- I agree to have read this project Security Policy
📝 Describe your problem
Hi!
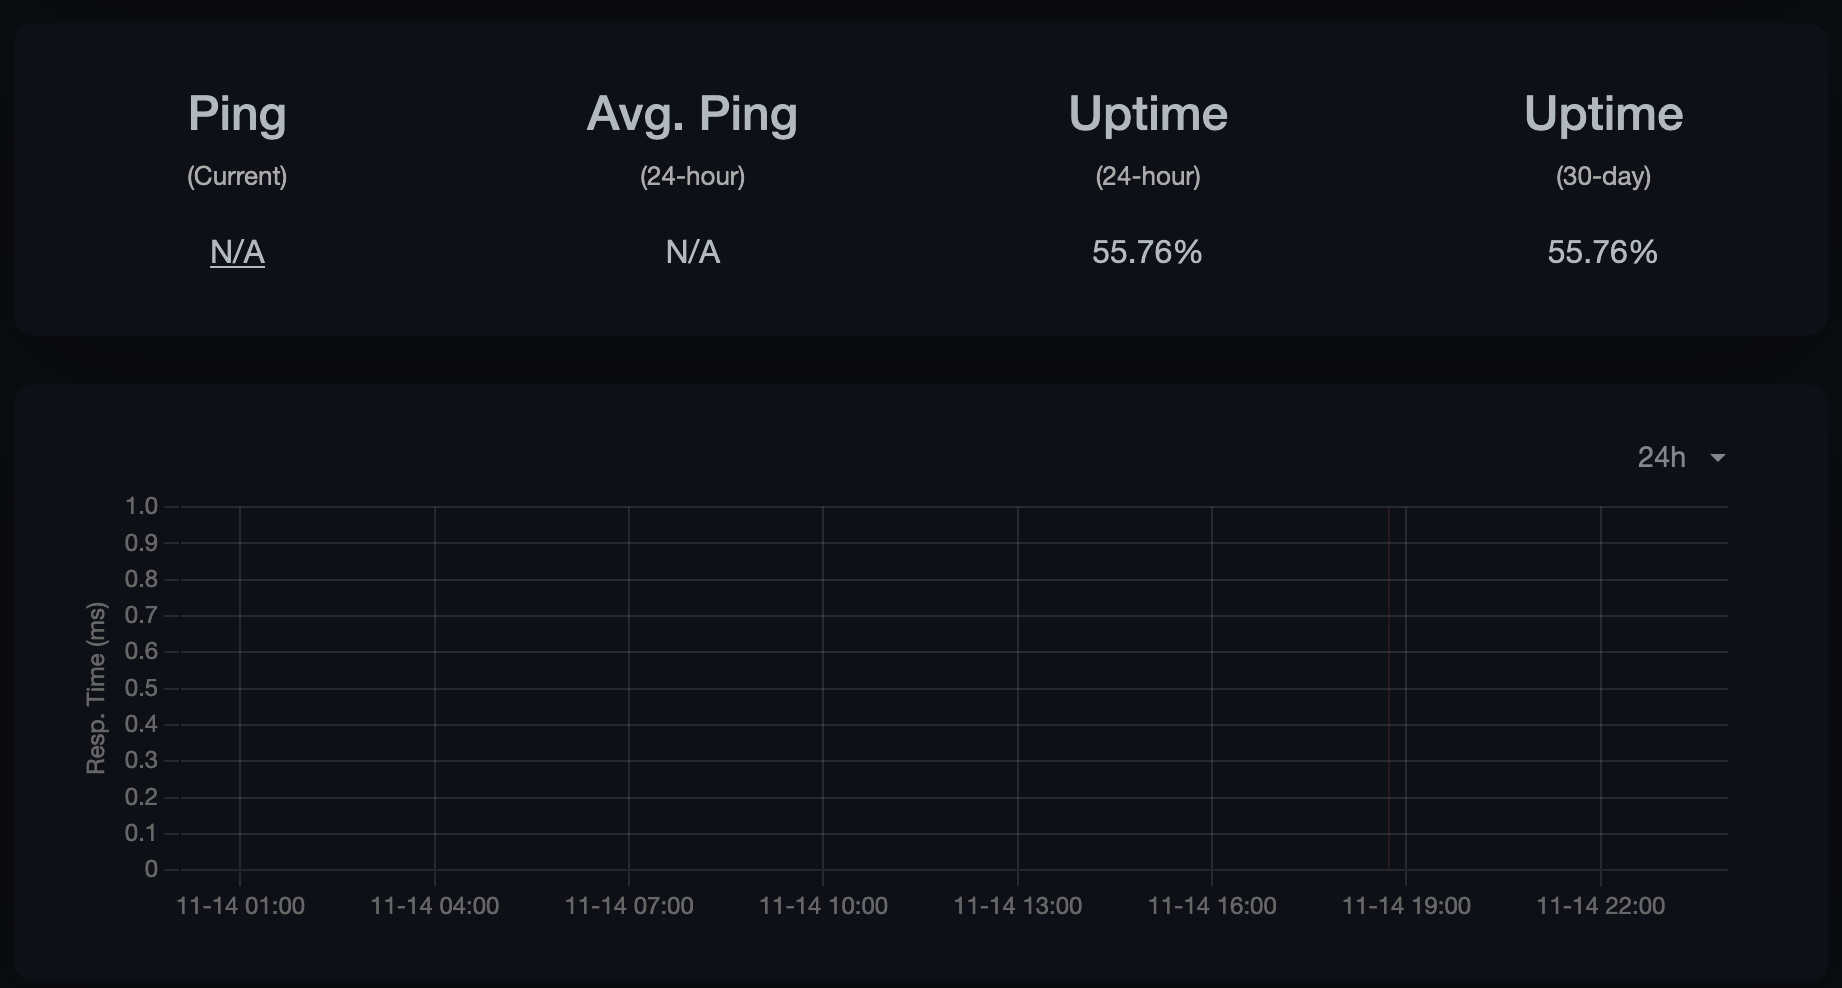
I am monitoring a service using the push monitor. Today, my service was down for 20 seconds and the uptime percentage dropped to less than 50%. After a few hours, it “recovered” to only 55%. I am wondering, how does the percentage gets calculated? I’d have expect to see it recover to 99% or something.
I attached a 24h log and also the events:
Up | 2021-11-14 18:44:20 | OK
Down | 2021-11-14 18:44:02 | No heartbeat in the time window
Up | 2021-11-14 00:34:11 | OK
Is there something I am missing?
🐻 Uptime-Kuma Version
1.10.1
💻 Operating System and Arch
Raspberian
🌐 Browser
Chrome
🐋 Docker Version
Docker version 20.10.8, build 3967b7d
🟩 NodeJS Version
No response
Issue Analytics
- State:

- Created 2 years ago
- Reactions:1
- Comments:10 (7 by maintainers)
 Top Results From Across the Web
Why does the SNMP System Uptime sensor report wrong ...
My SNMP System Uptime sensor shows incorrect uptimes. ... For display purposes, calculate the number of uptime days by dividing the retrieved value...
Read more >Network monitoring tools: How to calculate server uptime
How to calculate server uptime using network monitoring tools. When someone says five-nines" (99.999 percent) downtime is a mere 5 minutes per year......
Read more >Calculation of uptime and downtime - Uptrends
The way to calculate uptime is easy to understand: take the number of seconds that your monitor was down (in a certain time...
Read more >Server Downtime/Uptime Calculator - Formula & Percentages
Learn the easiest way to calculate server uptime and downtime using a ... when the number of errors, or “down” responses, received by...
Read more >what does the uptime numbers on windows task manager ...
2 Answers 2 · that's a really strange bug. · It is not really a bug - just how they calculate it. ·...
Read more > Top Related Medium Post
No results found
 Top Related StackOverflow Question
No results found
 Troubleshoot Live Code
Lightrun enables developers to add logs, metrics and snapshots to live code - no restarts or redeploys required.
Start Free Top Related Reddit Thread
No results found
 Top Related Hackernoon Post
No results found
 Top Related Tweet
No results found
 Top Related Dev.to Post
No results found
 Top Related Hashnode Post
No results found
Same issue here, instance using Docker 20.10.12 on Raspbian Buster, UK 1.11.4 Tested with push from same device every 60 seconds, no downtime for 220 minutes, stopped for 2 minutes and got 71.47%, expecting >99%
Hi, I believe I’m having the same issue. My router restarted, so a few services had a downtime for a few minutes. The “Home Assistant” ones % went down by less than one. It’s a web monitor.
All the others are Push monitors and are down by much more than expected. Those are python sending heartbeats
Same with heartbeats sent from bash/curl
I’m on a non-docker 1.11.4 install on a medium hetzner VPS running Ubuntu 18.04.6 LTS.