
Lightrun Answers was designed to reduce the constant googling that comes with debugging 3rd party libraries. It collects links to all the places you might be looking at while hunting down a tough bug.
And, if you’re still stuck at the end, we’re happy to hop on a call to see how we can help out.
How to choose the correct memory allocator?
See original GitHub issueFirst of all, I apologise for opening a new thread related to memory issues - I know there have been quite a few already, but this question (at least in my case) still remains unanswered. For the record, I have read through #955 and a bunch of issues related to that multiple times. I still need some help here, and I didn’t know which of the existing issues to revive, so here’s a new one.
The setup
I have created four test sharp operations (https://github.com/juona/sharp-memory-experiment/blob/master/generatePrintFile.js):
- Composite - takes 3 images, performs resize, extract and extend on each one of them, converts two of them into buffers using
toBuffer()and performs the composite operation to produce the final result in the form of a PNG file. This is the original function that I want to work well in my application. - Single - takes 1 image, performs resize, extract and extend and writes the result into a PNG file without using
toBuffer(). - Simple to file - takes a single image and writes it to a new file without any sharp operations.
- Simple to buffer - takes a single image and calls
toBuffer()on it and does nothing else, i.e. it just does nothing with the result.
The tests
Now, each of these operations would be run many times in a row under four different conditions to see what influence caching and concurrency have on the memory consumption:
- Sharp concurrency on (
sharp.concurrency(0)) and sharp cache on (sharp.cache(true)); - Sharp concurrency on (
sharp.concurrency(0)) and sharp cache off (sharp.cache(false)); - Sharp concurrency off (
sharp.concurrency(1)) and sharp cache on (sharp.cache(true)); - Sharp concurrency off (
sharp.concurrency(1)) and sharp cache off (sharp.cache(false));
Also, the previously described sharp operations would be run in chunks of 10, e.g. I would simultaneously launch 10 “composite” operations, let the program wait until they all finish, record the RSS and do that again.
This would be repeated until either the loop is repeated 100 times (so I have 100 readings of RSS) or the memory reaches 2GB on my Manjaro/1GB on my Mac.
Finally, the images used were two rather large (3400x2000, 11MB) and one small PNG files, all available in the repository (link below).
The whole test suite with instructions is available here: https://github.com/juona/sharp-memory-experiment.
The important bit
I ran these tests using three different memory allocators:
- On a Manjaro system using the default Manjaro allocator. I am not very good at computers/linux, so I don’t know which one it is. :]]
- On the same Manjaro system using jemalloc, as suggested in other threads, namely #955.
- On a Mac (10.14.6) using its default allocator.
The results
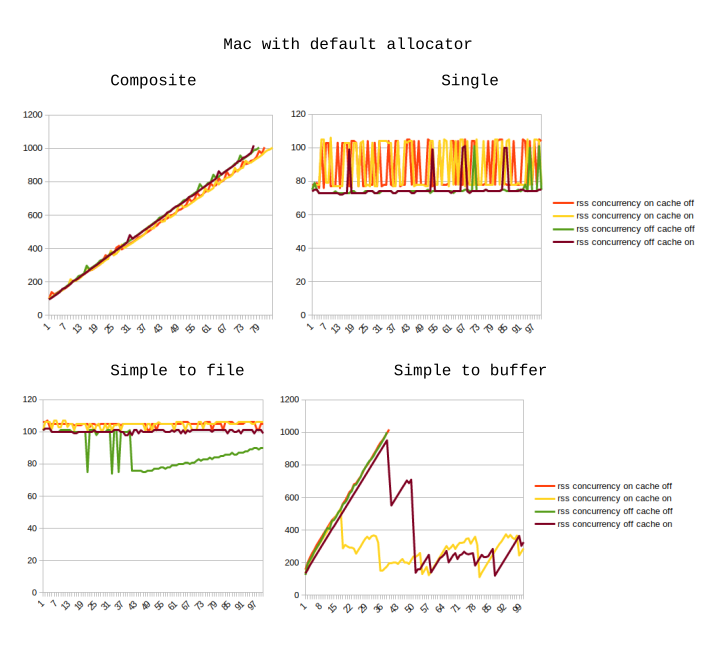
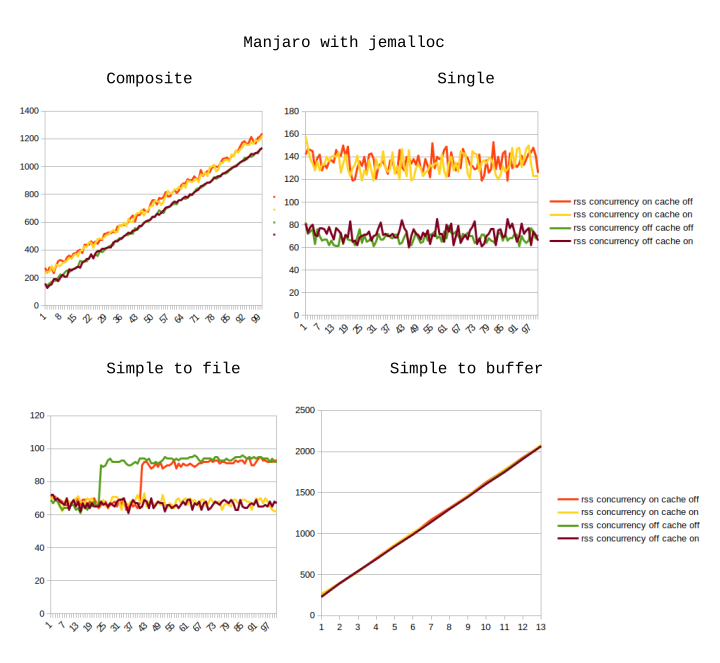
Here are the graphs of how memory consumption changes with each iteration. The X axis represents the iteration number (so, e.g. iteration 15 means the 15th time that a chunk of 10 sharp operations was finished). The Y axis is RSS as printed by NodeJS itself in MB.
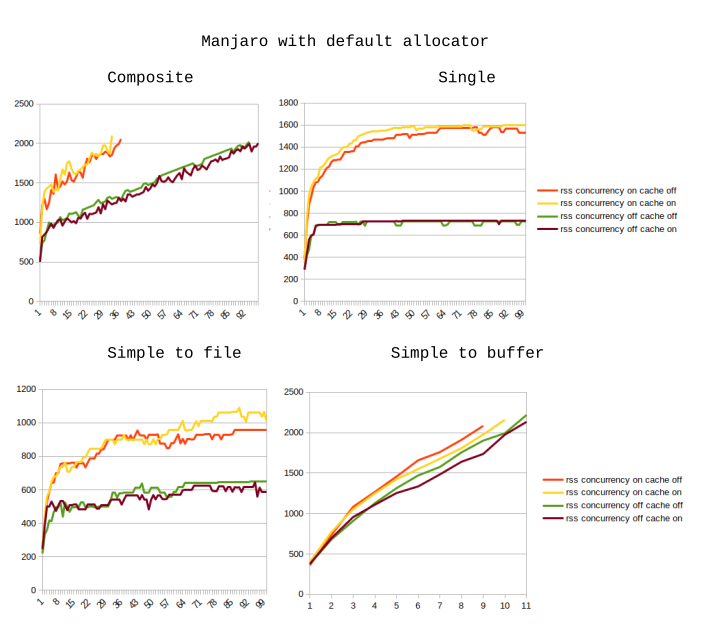
As you can see, the results using the default Manjaro allocator are so bad, that we can just ignore them.
On a Mac, the operations which do not involve buffers (“single” and “simple to file”) seem to only consume a little bit of memory, and the consumption is basically constant. However, the RSS changes during the “simple to buffer” test look quite odd (don’t know how to explain them), and during the “composite” operation (optimising which was my initial goal) the RSS is constantly increasing.
On the Manjaro system with jemalloc enabled, the behaviour is almost identical, except that the memory usage during “simple to buffer” is significantly higher and takes only 13 rounds to reach the 2GB mark.
Questions
- Would anyone who claims that they do not experience memory issues when running sharp on their system, care to try my tests out and see what happens?
- Given that jemalloc does not help me, how would I know which allocator to choose to fix or at least mitigate the problem? Perhaps there is something wrong with my code?
- How could these results be explained? E.g. when using the default Manjaro allocator, there appears to be some sort of RSS saturation. I know others have seen it too but I still don’t understand why it just does not keep increasing.
- More of a note rather than a question, but IMHO the “use a different memory allocator” suggestion is rather weird. I am yet to encounter software which would officially instruct users that “if you have problems with high RSS, use a different memory allocator”. And in case
libvipsis optimised to a specific allocator, then I’d expect the answer to question 2 to be a really easy one, right? If it’s not, then isn’t that an indicator of some peculiarities insidelibvips?
Issue Analytics
- State:

- Created 4 years ago
- Reactions:2
- Comments:12 (6 by maintainers)
 Top Related StackOverflow Question
 Troubleshoot Live Code
 Top Related Reddit Thread
 Top Related Hackernoon Post
 Top Related Tweet
 Top Related Dev.to Post
 Top Related Hashnode Post
Thanks @juona for these detailed test cases.
jemalloc helps reduce fragmentation in long-running, multi-threaded processes, at the cost of slightly higher peak memory usage (RSS), as it allocates from multiple arenas.
The logic in the
compositetest function appears to keep all intermediate images in scope, so they won’t become eligible for garbage collection until after the whole test function is complete, which could explain the pattern you’re seeing.As John suggests, forcing V8 to run garbage collection can help better determine the real peak memory requirement for this task as it may reduce the number of new allocations. Remember it’s still up to the OS to request that a process returns unused memory, so RSS can still include this freed memory when it is fragmented or smaller than the current page size.
Hello @juona,
I tried your test in pyvips, the libvips Python binding:
Then ran with:
And watched
RESintop:Memory management in node, especially when there are external libraries involved, is complex, with many interacting systems, most of which know little about each other 😦
In your buffer case, could it be that the node GC is simply not firing? Have you tried forcing a GC?
Start node with:
Then add this to your loop:
No use in production, of course, but it might help explain the memory behaviour you are seeing.