
Lightrun Answers was designed to reduce the constant googling that comes with debugging 3rd party libraries. It collects links to all the places you might be looking at while hunting down a tough bug.
And, if you’re still stuck at the end, we’re happy to hop on a call to see how we can help out.
Initial debug configurations
See original GitHub issueDescribe the bug I had trouble setting up the extension, because
- I expected the extension to come with a basic debug configuration, but
- I did not see it - I had to add one to
launch.jsonmyself.
I found this, so you are probably aware of automatic debug configurations:
https://github.com/ManuelHentschel/VSCode-R-Debugger/blob/4fd0e703860a53cffbbc9fe2d086bd949098a078/src/extension.ts#L25
(Update: I guess I was wrong here: you’re not using DebugConfigurationProviderTriggerKind.Dynamic nor onDebugDynamicConfigurations anywhere.)
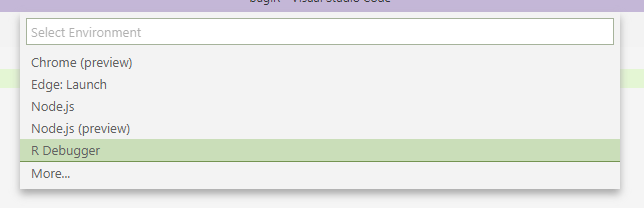
But as I said, I don’t see them. This is after I click “Show all automatic debug configurations”:

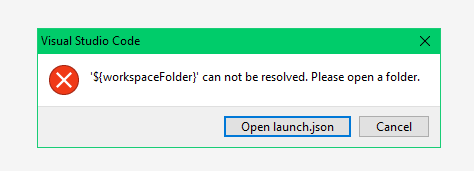
What works is pressing F5 - then, I get this:
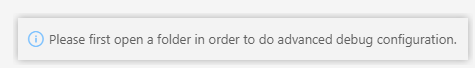
but then this:
and this:
So then I opened C:\Temp. Debug configurations are still empty.
Then, upon F5, I get this:
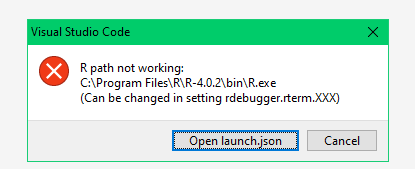 (Which is weird because
 C:\Program Files\R\R-4.0.2\bin\R.exe is exactly the path my R binary.)
Still, clicking “Open launch.json”, it opens a launch.json with three entries pre-filled (Launch Workspace, Debug R-File, Debug R-Function). And now I also see them in the launch panel, and debugging works without changing any path.
In summary:
- One needs to open a folder workspace for debugging to work.
- Something is weird with the R path before the debug config is added
- Automatic debug configs do not seem to work(?). Compare https://code.visualstudio.com/updates/v1_45#_automatic-debug-configurations https://code.visualstudio.com/updates/v1_45#_providing-debug-configurations-dynamically
Issue Analytics
- State:

- Created 3 years ago
- Comments:21 (13 by maintainers)
 Top Related StackOverflow Question
 Troubleshoot Live Code
 Top Related Reddit Thread
 Top Related Hackernoon Post
 Top Related Tweet
 Top Related Dev.to Post
 Top Related Hashnode Post
This is probably intentional, since listing all automatic debug configurations would require activating all installed debugger extensions, which might take some time
I just added automatic quotes if the path contains spaces and an option to add custom command line arguments for the call to R. Thah should hopefully work for everyone.