How can I show edges in a VTU mesh?
See original GitHub issueI am trying to use vedo to plot an unstructured 3D surface mesh and here’s what I did:
from vedo import load, show
surf_mesh = load('surface_mesh_with_topo.vtu)
show(surf_mesh)
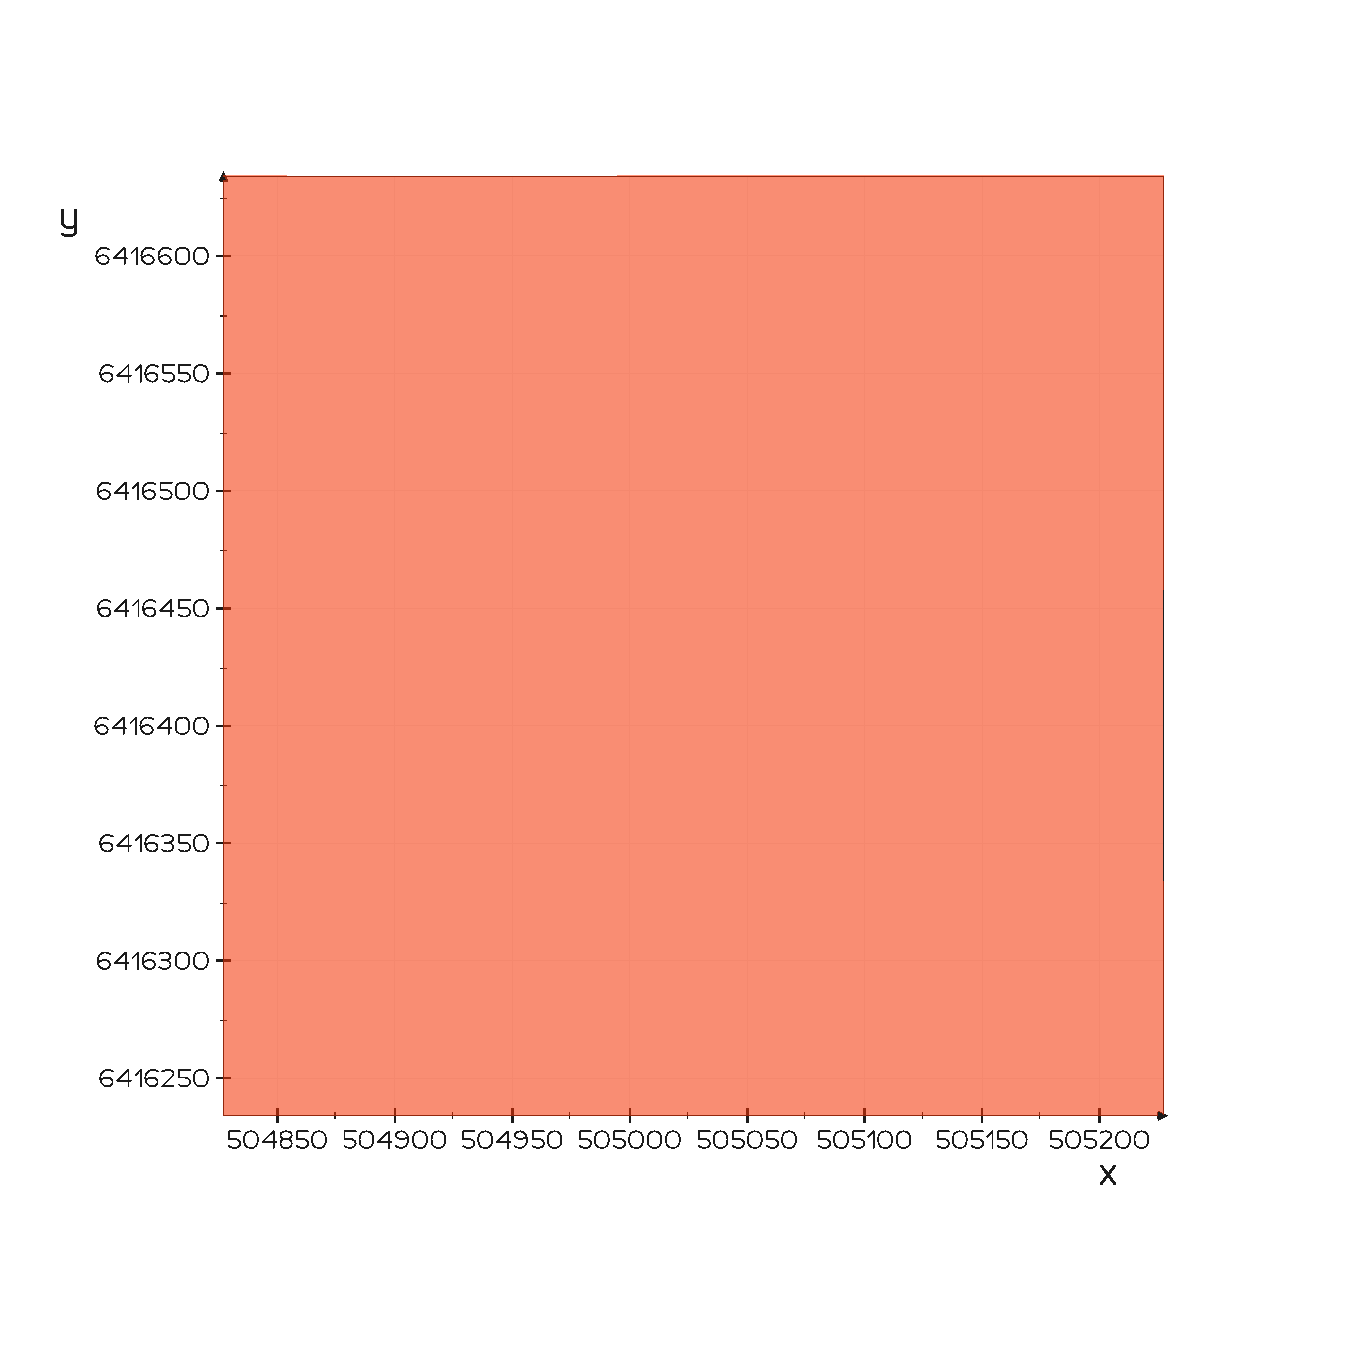
And here’s what was plotted:

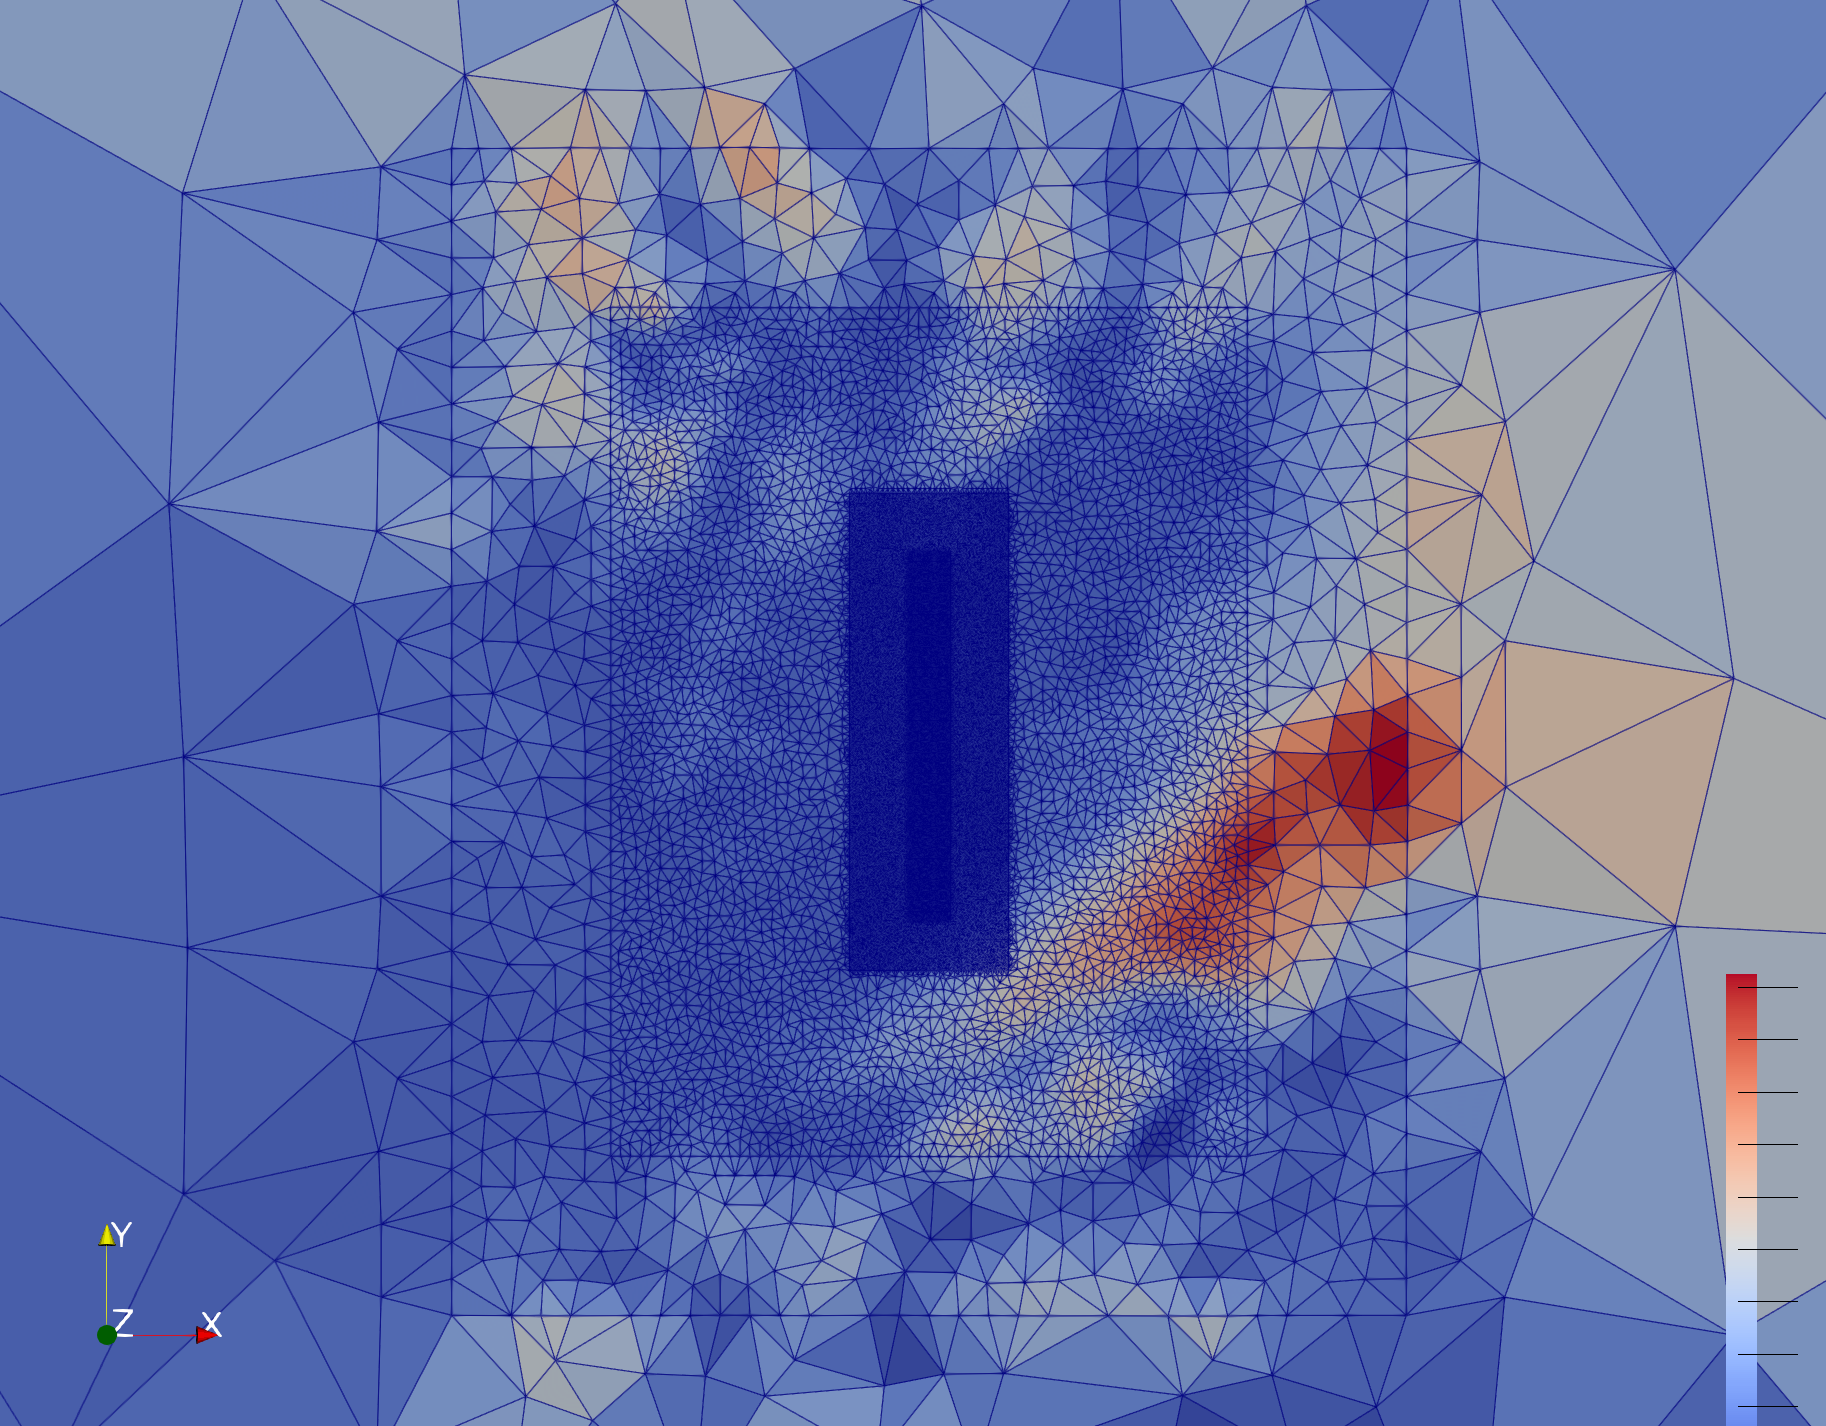
As you can see, there is not a single edge shown here. The following screenshot shows how the mesh looks like in Paraview:

How can I show the edges of the unstructured mesh and set its colors?
Here is the mesh file:
Issue Analytics
- State:
- Created 2 years ago
- Comments:18 (18 by maintainers)
 Top Results From Across the Web
[Paraview] display boundaries of 2D geometry
Hi, is there a way to display the boundaries (edges) of a 2D geometry? I have converted my mesh to vtu using Elmergrid,...
Read more >[Paraview] display boundaries of 2D geometry - Kitware Inc.
Zenker at erbe-med.com> wrote: Hi, is there a way to display the boundaries (edges) of a 2D geometry? I have converted my mesh...
Read more >3. Understanding Data - ParaView Documentation
In general, a mesh consists of vertices (points ) and cells (elements, zones). ... VTK natively supports Berger-Oliger type AMR datasets, as shown...
Read more >Map NetCDF data on OGS-VTU mesh - Usability
Just right-click on ExtractSelection in the pipeline browser, then Add Filter->Alphabetical->Clip . Set Click Type to Plane ; the Origin close ...
Read more >Extract Triangles IDs from VTU file - python - Stack Overflow
If I now load the same pvtu in Python and display the mesh in the following manner, import numpy import matplotlib.pyplot as plt...
Read more > Top Related Medium Post
No results found
 Top Related StackOverflow Question
No results found
 Troubleshoot Live Code
Lightrun enables developers to add logs, metrics and snapshots to live code - no restarts or redeploys required.
Start Free Top Related Reddit Thread
No results found
 Top Related Hackernoon Post
No results found
 Top Related Tweet
No results found
 Top Related Dev.to Post
No results found
 Top Related Hashnode Post
No results found

Sorry, I am pretty sure I did not use the code in Github. Now I do, and the issue is fixed. That elevation parameter is really convenient!
I can confirm that Shift-C and Shift-A do what you described. Now I am happy about this picture. I should be trying to reproduce something other pictures that I used to plot with Paraview just for fun. Thanks!
11.2.3. I am about to update the OS but have not done that.
I think from what I saw, that did not solve the problem for wand.