
Lightrun Answers was designed to reduce the constant googling that comes with debugging 3rd party libraries. It collects links to all the places you might be looking at while hunting down a tough bug.
And, if you’re still stuck at the end, we’re happy to hop on a call to see how we can help out.
Inverted y-axis y x3d export
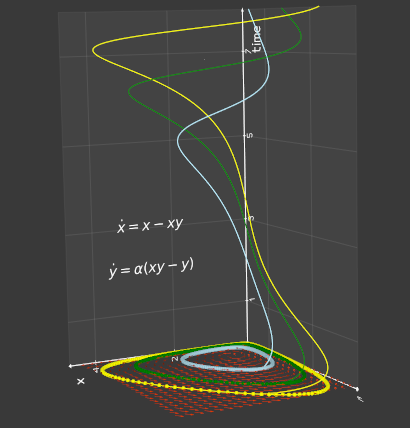
See original GitHub issueI was testing the web export feature with one of the examples. I used the Lotka-Volterra one. When I run it as a script I get the same result as the one shown in the gallery of examples:
However, when I try to get a html page by running the following code (it is the original plus the last line and without the .close() on the show):
"""The Lotka-Volterra model where:
x is the number of preys
y is the number of predators
"""
#Credits:
#http://visual.icse.us.edu.pl/NPB/notebooks/Lotka_Volterra_with_SAGE.html
#as implemented in K3D_Animations/Lotka-Volterra.ipynb
#https://en.wikipedia.org/wiki/Lotka%E2%80%93Volterra_equations
import numpy as np
from scipy.integrate import odeint

def rhs(y0, t, a):
    x, y = y0[0], y0[1]
    return [x-x*y, a*(x*y-y)]

a_1 = 1.2
x0_1, x0_2, x0_3 = 2.0, 1.2, 1.0
y0_1, y0_2, y0_3 = 4.2, 3.7, 2.4

T = np.arange(0, 8, 0.02)
sol1 = odeint(rhs, [x0_1, y0_1], T, args=(a_1,))
sol2 = odeint(rhs, [x0_2, y0_2], T, args=(a_1,))
sol3 = odeint(rhs, [x0_3, y0_3], T, args=(a_1,))

limx = np.linspace(np.min(sol1[:,0]), np.max(sol1[:,0]), 20)
limy = np.linspace(np.min(sol1[:,1]), np.max(sol1[:,1]), 20)
vx, vy = np.meshgrid(limx, limy)
vx, vy = np.ravel(vx), np.ravel(vy)
vec = rhs([vx, vy], t=0.01, a=a_1)

origins = np.stack([np.zeros(np.shape(vx)), vx, vy]).T
vectors = np.stack([np.zeros(np.shape(vec[0])), vec[0], vec[1]]).T
vectors /= np.stack([np.linalg.norm(vectors, axis=1)]).T * 5

curve_points1 = np.vstack([np.zeros(sol1[:,0].shape), sol1[:,0], sol1[:,1]]).T
curve_points2 = np.vstack([np.zeros(sol2[:,0].shape), sol2[:,0], sol2[:,1]]).T
curve_points3 = np.vstack([np.zeros(sol3[:,0].shape), sol3[:,0], sol3[:,1]]).T

########################################################################
from vedo import *

plt = Plotter(bg="blackboard")
plt += Arrows(origins, origins+vectors, c='lr')

plt += Points(curve_points1, c='y')
plt += Line(curve_points1, c='y')
plt += Line(np.vstack([T, sol1[:,0], sol1[:,1]]).T, c='y')

plt += Points(curve_points2, c='g')
plt += Line(curve_points2, c='g')
plt += Line(np.vstack([T, sol2[:,0], sol2[:,1]]).T, c='g')

plt += Points(curve_points3, c='lb')
plt += Line(curve_points3, c='lb')
plt += Line(np.vstack([T, sol3[:,0], sol3[:,1]]).T, c='lb')

plt += Latex(r'\dot{x}=x-x y',        c='white').rotateZ(-90).pos(4,6.5,0)
plt += Latex(r'\dot{y}=\alpha(xy-y)', c='white').rotateZ(-90).pos(3,6.5,0)

plt += __doc__

plt.show(axes={'xtitle':'time',
               'ytitle':'x',
               'ztitle':'y',
               'zxGrid':True, 'yzGrid':False},
         viewup='x',
)

exportWindow('test_page.x3d')
I get a representation that has the plan from the y axis with the reversed direction:

Is this behaviour expected? also there are some texts missing.
here is the output from vedo --info :
_________________________________________________________________
vedo version      : 2021.0.6   https://vedo.embl.es
vtk version       : 9.0.3
python version    : 3.9.7 (default, Sep 24 2021, 09:43:00) [GCC 10.3.0]
python interpreter: /usr/bin/python3
vedo installation : /home/manuel/.local/lib/python3.9/site-packages/vedo
system            : Linux 5.14.0-2-amd64 posix x86_64
k3d version       : 2.11.0
ipyvtk version    : 0.1.4
Issue Analytics
- State:

- Created 2 years ago
- Comments:6 (3 by maintainers)
 Top Related StackOverflow Question
 Troubleshoot Live Code
 Top Related Reddit Thread
 Top Related Hackernoon Post
 Top Related Tweet
 Top Related Dev.to Post
 Top Related Hashnode Post
Thank you very much, works as expected now
cool! I updated the web page with a nice rendering 😃 thanks for drawing my attention to this