
Lightrun Answers was designed to reduce the constant googling that comes with debugging 3rd party libraries. It collects links to all the places you might be looking at while hunting down a tough bug.
And, if you’re still stuck at the end, we’re happy to hop on a call to see how we can help out.
Interactive figures in sphinx/readthedocs?
See original GitHub issueHi,
I was wondering if it was possible to embed the interactive figures in the sphinx documentation pages.
All the ipywidgets are visible and interactive in the doc pages (https://ipywidgets.readthedocs.io/en/stable/examples/Widget List.html).
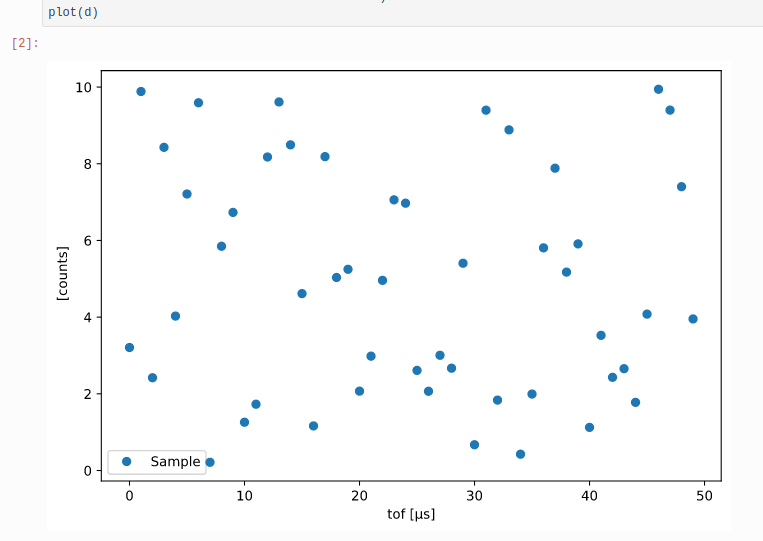
I tried building my documentation with ipympl instead of the inline backend, but only the control buttons are showing up, not the figure:
 instead of
 with the
 inline backend.
I’m thinking in principle, the figure is just using some javascript to display it in jupyter, so it should also be possible to show it in the doc pages. Many thanks for any help.
Issue Analytics
- State:

- Created 3 years ago
- Comments:8 (5 by maintainers)
 Top Related StackOverflow Question
 Troubleshoot Live Code
 Top Related Reddit Thread
 Top Related Hackernoon Post
 Top Related Tweet
 Top Related Dev.to Post
 Top Related Hashnode Post
Hi Martin,
Thanks for the swift reply. I see, so everything is done on the kernel side. Now that i’m looking at it again more closely, I can indeed see that the kernel is working when i’m panning/zooming. And this is also the case for the classical
notebookbackend.Ok, it’s not a huge deal, I thought it would have been nice to be able to use a single backend for everything. Right now, i’m having to juggle between 3 different backends: the
nbAggfor the classical notebook, theipymplfor JupyterLab, andinlinefor the docs.If you are interested (i know you guys at QuantStack like working with C++), we are working on a library for multi-dimensional arrays which is similar to
xarraybut with a C++ core under a python interface: https://scipp.github.io/index.html. So it’s also similar toxtensorbut with the added labeled dimensions.Cheers
Hi Martin, Yes we looked at
xframealso (actually, it was probablyxframeI wanted to reference in my post above, instead ofxtensor), and we decided it was still a bit too early in development to rely on it for our science program. It would also have probably taken some time before we could incorporate changes such as event data (basically like a vector of arbitrary length vectors), physical units, and uncertainty propagation, all of which we needed from basically day 1. The lazy evaluation is, however, a really nice feature that we are still missing. We are keeping an eye on how things develop. Cheers.