Consider adding a mechanism akin to .NET's 'DebuggerTypeProxyAttribute' for JS/TS debugging
See original GitHub issueWhen debugging a program written for .NET in Visual Studio, there are certain attributes that can be used to control how the debugger interacts with various objects. The DebuggerTypeProxyAttribute provides a way to inform the debugger how to represent a value in the “Watch” view.
JS does not have a way to define such metadata for its types, and while the Decorators proposal is still under active development it would still likely only serve as half the story.
An alternative solution I am proposing is roughly this:
- A developer define a well-known
Symbolto add as a key to a class (i.e.,const debuggerProxySym = Symbol.for("vscode:debugger-type-proxy"). - A developer can add that symbol as a method of the class (i.e.,
class C { [debuggerProxySym]() { ... } }. - In the launch.config, the well-known symbol identity could be added as a configuration option.
- When a value with the configured symbol is shown in the “Watch” or “Locals” window, that method is called and its result is used in place of the original value.
In this way, configuration is flexible and up to the end user and it doesn’t depend on proposing new syntax to ECMAScript. In addition, should the Decorators proposal land as a feature in the future this could also leverage decorators (i.e., @DebuggerTypeProxy(() => { ... }) class C {}, where DebuggerTypeProxy merely sets the same kind of symbol, above).
Also, the default configuration could conceivably also include the existing inspect.custom symbol in NodeJS’s "util" module.
A similar design could theoretically be employed to allow for behaviors similar to .NET’s other DebuggerXAttribute controls, such as:
- A
debugger-displaysymbol to provide a simplified text view for a value in the “Locals” or “Watch” window, similar to .NET’sDebuggerDisplayAttribute. - A
debugger-visualizersymbol to further control how a value in “Locals” or “Watch” is rendered (though this is obviously more complex). - A
debugger-hiddensymbol to force the debugger to step over code inside of a function/method with this property (but still step into methods invoked by the function), similar to .NET’sDebuggerHiddenAttribute. - As well as symbols for other, related attributes such as
DebuggerNonUserCodeAttribute,DebuggerStepThroughAttribute, etc.
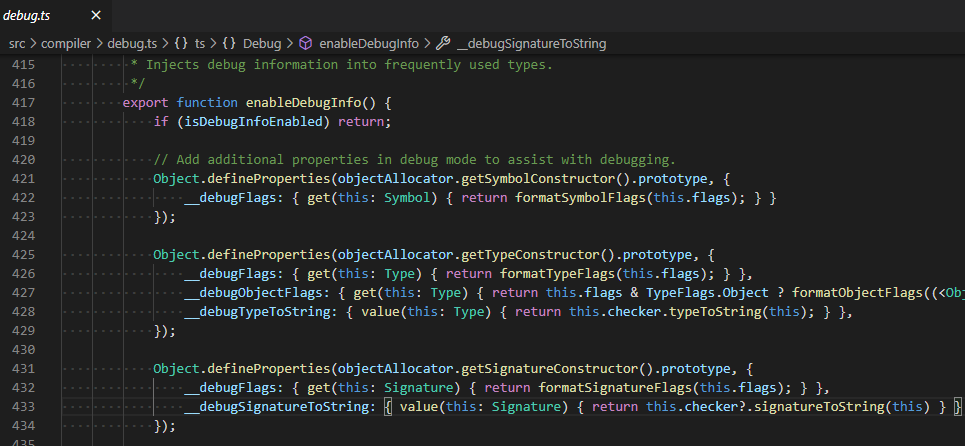
An example of how this would help can be seen in the TypeScript compiler itself. Since TypeScript enums are compiled down to number values, its often complex to correlate a flag value back to the enum value. When debugging, we explicitly add additional properties to internal classes like Node, Symbol, and Type to make our lives easier, but first-class support for this behavior would be much more appealing:
What we do today:

What would be nice to have in the future:
// debug.ts
namespace ts.Debug {
  export const debuggerDisplay = Symbol.for("vscode:debugger-display");
  export const debuggerTypeProxy = Symbol.for("vscode:debugger-type-proxy");
  export const debuggerHidden = Symbol.for("vscode:debugger-hidden");
  export const debuggerBrowsable = Symbol.for("vscode:debugger-browsable");
}
// core.ts
export function map<T, U>(array: T[] | undefined, cb: (v: T) => U): U[] | undefined { ... }
// F11 steps over calls to `map`, but still steps into `cb`...
map[Debug.debuggerHidden] = true;

// utilities.ts
function Symbol() { ... }
Symbol.prototype[Debug.debuggerDisplay] = "{escapedName}";

function Type() { ... }
Type.prototype[Debug.debuggerTypeProxy] = function() {
  return {
    ...this,
    [Debug.debuggerDisplay]: "{name} {flagsString}",
    [Debug.debuggerBrowsable]: { name: false, flagsString: false },
    name: this.symbol?.escapedName,
    flagsString: Debug.formatTypeFlags(this.flags)
  }
};
// launch.json
{
  // ...
  "configurations": [
    {
      // ...
      "debugSymbols": {
        "display": ["vscode:debugger-display", "nodejs.util.inspect.custom"], // the key for `require("util").inspect.custom` in NodeJS
        "typeProxy": ["vscode:debugger-type-proxy"],
        "hidden": ["vscode:debugger-hidden"],
        "browsable": ["vscode:debugger-browsable"]
      }
    }
  ]
}
Issue Analytics
- State:
- Created 3 years ago
- Reactions:2
- Comments:13 (7 by maintainers)

 Top Related StackOverflow Question
@justingrant I’m not sure if this launch.json parameter has been released yet, if it is:
should call this.toString() to generate the description of objects shown in variables, watch, etc…
The entrance of your script, i.e. the first line of your script. If you are using a JS framework, call it in the initialization or constructor of the root component.