
Stuck on an issue?
Lightrun Answers was designed to reduce the constant googling that comes with debugging 3rd party libraries. It collects links to all the places you might be looking at while hunting down a tough bug.
And, if you’re still stuck at the end, we’re happy to hop on a call to see how we can help out.
Bug in vector source estimate plotting
See original GitHub issueDescribe the bug
This was reported to me by @rythorpe. The vector source estimate does not plot arrows for the somato data.
Steps and/or code to reproduce
Here is a gist to reproduce the problem. I don’t see any issue with the script. Indeed, if you do:
print(stc)
you get:
<VectorSourceEstimate | 8155 vertices, subject : 01, tmin : -199.79521315838787 (ms), tmax : 199.79521315838792 (ms), tstep : 3.3299202193064645 (ms), data shape : (8155, 3, 121)>
and if you do:
print(stc.data.shape)
you get:
(8155, 3, 121)
indicating that the stc is vector.
Expected results
There should be an arrow plot
Actual results
but the plot shows:
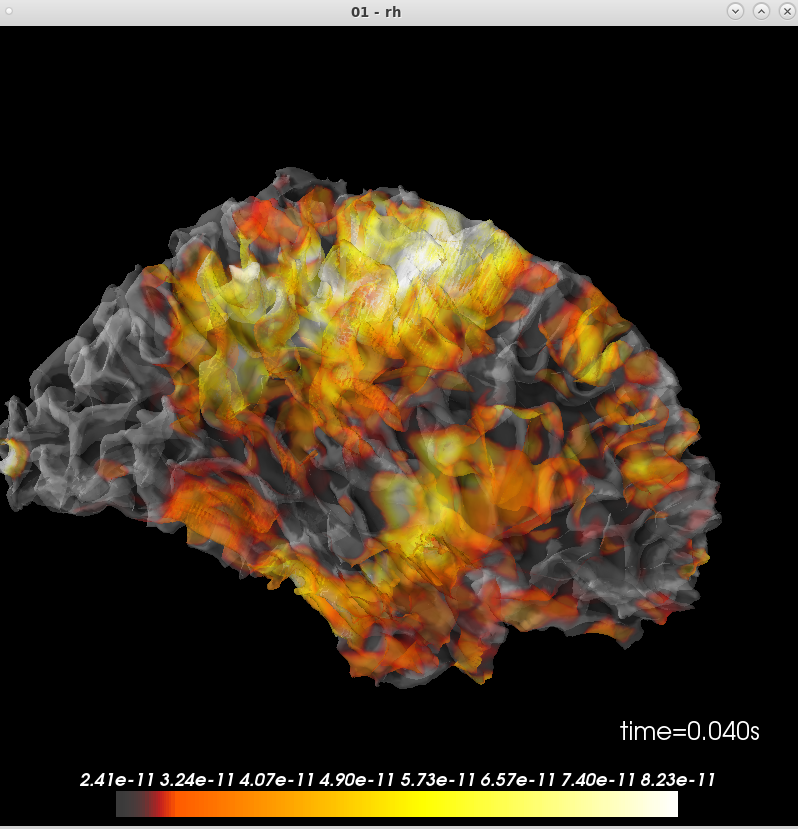
Additional information
I’m on the latest master, commit 42948689e.
and mne.sys_info() gives:
Platform:      Linux-3.10.0-957.1.3.el7.x86_64-x86_64-with-centos-7.6.1810-Core
Python:        3.6.7 | packaged by conda-forge | (default, Feb 28 2019, 09:07:38)  [GCC 7.3.0]
Executable:    /autofs/space/meghnn_001/users/mjas/anaconda3/envs/mne/bin/python
CPU:           x86_64: 64 cores
Memory:        125.3 GB

mne:           0.20.dev0
numpy:         1.15.4 {blas=mkl_rt, lapack=mkl_rt}
scipy:         1.2.1
matplotlib:    3.0.2 {backend=Qt5Agg}

sklearn:       0.20.2
numba:         Not found
nibabel:       2.3.3
cupy:          Not found
pandas:        0.24.1
dipy:          0.15.0
mayavi:        4.7.0.dev0 {qt_api=pyqt5, PyQt5=5.9.2}
pyvista:       Not found
vtk:           8.1.2
Issue Analytics
- State:

- Created 4 years ago
- Comments:18 (18 by maintainers)
 Top Results From Across the Web
Plotting the full vector-valued MNE solution
When visualizing a source estimate, it is sometimes useful to show the dipole directions in addition to their estimated magnitude.
Read more >OpenBUGS User Manual Contents - MRC Biostatistics Unit
Instead of just summary statistics, it represents the entire posterior distribution through shading. A density estimate of the distribution is computed, as ...
Read more >Quiver or vector plot - MATLAB quiver - MathWorks
First, create a grid of x- and y-values that are equally spaced. Use them to calculate z. Then, find the gradient of z...
Read more >FTOOLS/fv - HEASARC - NASA
Bug fixed : Issue with vector column plotting. ... fv's plot, calculator, histogram and statistics tools now can perform on the selected rows....
Read more >Introduction to RevGadgets - RevBayes
Getting Started; Visualizing Parameter Estimates; Visualizing Phylogenies. Basic tree plots; Fossilized birth-death trees; Coloring branches ...
Read more > Top Related Medium Post
No results found
 Top Related StackOverflow Question
No results found
 Troubleshoot Live Code
Lightrun enables developers to add logs, metrics and snapshots to live code - no restarts or redeploys required.
Start Free Top Related Reddit Thread
No results found
 Top Related Hackernoon Post
No results found
 Top Related Tweet
No results found
 Top Related Dev.to Post
No results found
 Top Related Hashnode Post
No results found
@GuillaumeFavelier feel free to try out the 3D version to see if you can get something satisfying. We can have an option for
glyph='arrow2d' | 'arrow3d'or so if it ends up looking goodI haven’t looked at how this is currently handled in the code, so maybe this is a dumb idea, but it seems to me that you will never want your longest arrow to be longer than, say, 1/5 the width of a cerebral hemisphere at most. Would it be enough to always scale such that the longest arrow ends up that size?
On November 5, 2019 8:24:08 AM PST, Mainak Jas notifications@github.com wrote: