
Stuck on an issue?
Lightrun Answers was designed to reduce the constant googling that comes with debugging 3rd party libraries. It collects links to all the places you might be looking at while hunting down a tough bug.
And, if you’re still stuck at the end, we’re happy to hop on a call to see how we can help out.
BUG, VIZ: can't use `fig.subplots_adjust` on `raw.plot` figure
See original GitHub issuewell, you can, but it looks awful:
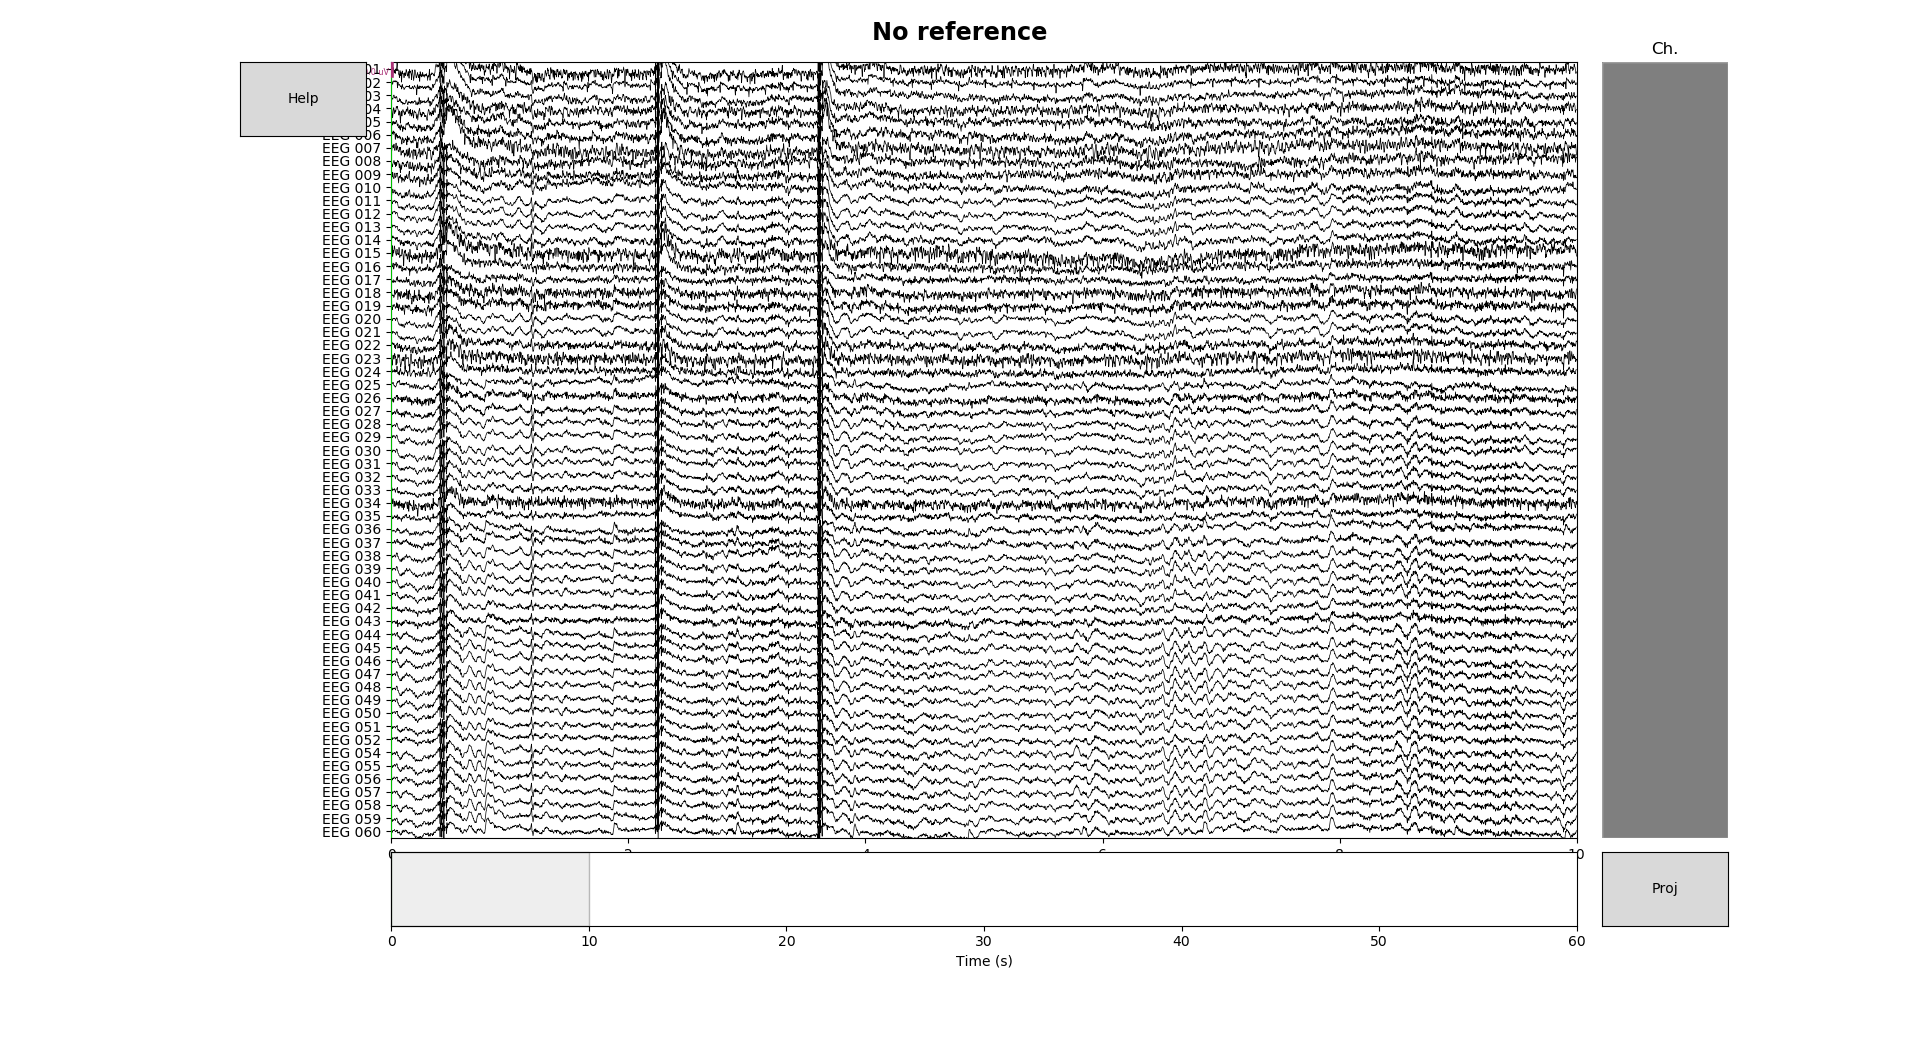
Note especially the Help button and the extra-wide channel and time scrollbars. This resulted from:
eeg_picks = mne.pick_types(raw.info, meg=False, eeg=True)
fig = raw.plot(proj=False, order=eeg_picks, n_channels=len(eeg_picks))
fig.subplots_adjust(top=0.94)
fig.suptitle('No reference', size='xx-large', weight='bold')
Possible solutions include:
- leaving enough room for a title at the top edge by default (and possibly putting the title on the plot instead of / in addition to in the window titlebar)
- debugging to figure out why it gets so messed up currently, and fixing it so that
subplots_adjustworks more or less normally
Issue Analytics
- State:

- Created 4 years ago
- Comments:5 (5 by maintainers)
 Top Results From Across the Web
Chapter 4. Visualization with Matplotlib - O'Reilly
A visualization you can't see won't be of much use, but just how you view your ... In [ 5 ]: fig =...
Read more >Matplotlib subplots_adjust hspace so titles and xlabels don't ...
With, say, 3 rows of subplots in matplotlib, xlabels of one row can overlap the title of the next. One has to fiddle...
Read more >Chart visualization — pandas 1.5.2 documentation - PyData |
When y is specified, pie plot of selected column will be drawn. If subplots=True is specified, pie plots for each column are drawn...
Read more >matplotlib.pyplot.subplots_adjust
Adjust the subplot layout parameters. Unset parameters are left unmodified; initial values are given by rcParams["figure.subplot.[name]"] ...
Read more >Filtering and Epoching MNE-HCP - MNE Forum - Discourse
External Email - Use Caution Hi all, I am still working with the MNE-HCP tools, ... mne.viz.plot_projs_topomap(projs, info=raw.info)
Read more > Top Related Medium Post
No results found
 Top Related StackOverflow Question
No results found
 Troubleshoot Live Code
Lightrun enables developers to add logs, metrics and snapshots to live code - no restarts or redeploys required.
Start Free Top Related Reddit Thread
No results found
 Top Related Hackernoon Post
No results found
 Top Related Tweet
No results found
 Top Related Dev.to Post
No results found
 Top Related Hashnode Post
No results found
+1 for “z” meaning “zen” mode 😃
But yes I agree we should fix how we lay out the figure somehow so that
subplots_adjustworksMay have hit a wall on this one, so I’ve resorted to stackoverflow: https://stackoverflow.com/q/57503564/1664024