
Lightrun Answers was designed to reduce the constant googling that comes with debugging 3rd party libraries. It collects links to all the places you might be looking at while hunting down a tough bug.
And, if you’re still stuck at the end, we’re happy to hop on a call to see how we can help out.
DOC: Improve doc of "threshold" in permutation cluster funcs
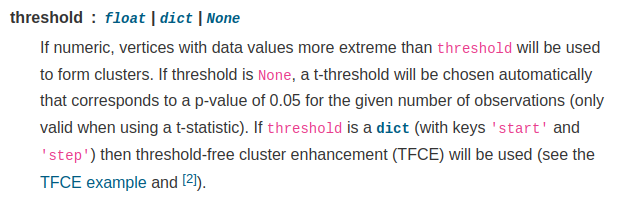
See original GitHub issueSeveral cluster permutation functions in the stats module have a threshold parameter, for example: mne.stats.spatio_temporal_cluster_1samp_test. See screenshot below for a quick view of the param:
I think we should improve the documentation in several ways:
- Seeing “float” as a possible input, people may confuse this threshold with an “alpha” level and input something like the conventionally used p-thresholds like
0.001or0.05 - Instead, a “t” (or “F”) threshold is the expected input. In some tutorials, we can see how to use it, for example here and here: It’s something like this -->
threshold = stats.distributions.t.ppf(1 - alpha, n_subjects - 1)… yet the tutorials also quote other options like putting a-before the threshold or dividing it by zero (either the threshold, or the “alpha”) in brackets: I find this whole thing confusing: When is a users supposed to use which method? --> Overall, most people (including myself) will think in terms of alpha levels (p-value-thresholds), rather than t-values: We should make this easy - in
mne.stats.ttest_1samp_no_pThere are some further notes on this that seem out of place:thresh = -scipy.stats.distributions.t.ppf(p_thresh, n_samples - 1) / 2.--> in this function, no threshold parameter is even present 🙂
I am happy to make the doc changes if you all agree and if somebody helps me figure this out.
TL;DR: We should clearly state how people get from an idea like “I want to do a one-sided t-test on the upper tail with a p-value threshold of 0.05” to a value to pass to the threshold parameter.
cc @nomisciri
Issue Analytics
- State:

- Created a year ago
- Comments:8 (8 by maintainers)
 Top Related StackOverflow Question
 Troubleshoot Live Code
 Top Related Reddit Thread
 Top Related Hackernoon Post
 Top Related Tweet
 Top Related Dev.to Post
 Top Related Hashnode Post
@sappelhoff
I’m now adding a plot like the following to our reports
This makes it easier to understand which time points were used to form clusters (I will next work on spatio-temporal tests, where instead of a trace I will probably show some kind of heatmap)
See https://output.circle-artifacts.com/output/job/af14b1ea-65f5-46c3-8a44-b7cdaa0710c2/artifacts/0/reports/ERP_CORE/sub-average_ses-N400_task-N400_report.html#global10
The respective PR is at https://github.com/mne-tools/mne-bids-pipeline/pull/552
We don’t cover the sign of the threshold there, I’m afraid …
Your question was about the sign, right?
It depends on the tail of the distribution you want to look at. For example, this is what we do when the user does not provide a custom threshold and we calculate our own default:
https://github.com/mne-tools/mne-python/blob/cc86f163126ad1aa950f1909062abe5e9b1888c5/mne/stats/cluster_level.py#L1035-L1036
In case the user does provide a threshold, we have a fail-safe built in that checks for reasonable combinations of
thresholdandtail:https://github.com/mne-tools/mne-python/blob/cc86f163126ad1aa950f1909062abe5e9b1888c5/mne/stats/cluster_level.py#L846-L849
And this is the reason why in the one example we have to flip the sign of the t value:
Let’s assume we have 20 participants and want to compare a within-subjects design; to form our initial clusters, we want to find a t-value that separates the most extreme 7% of the expected t-values from the other 93%.
(I picked the odd number 7% here on purpose as to avoid confusion with the “alpha level” which we’ll later use to determine significance of the clusters, and which is typically set at 5%).
We don’t have a clear justification to believe the effect will only go into one specific direction; so we need to perform a two-sided test. This means we need to partition those 7% extreme values into two times 3.5% at the extremes:
Now this is a negative value because the distribution is centered on 0 and we’re getting the t-value corresponding to the “leftmost” (smallest) 3.5% of the distribution!
But the “fail-safe” in our code won’t allow us to pass a negative
thresholdtogether with atail=0(two-sided test)So we have two potential solutions here:
-1, as in the example you quotedI agree that in our example, 1. is not very clear, and we should use 2. instead.
Does this help you a little?