
Stuck on an issue?
Lightrun Answers was designed to reduce the constant googling that comes with debugging 3rd party libraries. It collects links to all the places you might be looking at while hunting down a tough bug.
And, if you’re still stuck at the end, we’re happy to hop on a call to see how we can help out.
Evoked.plot_topomap() behaves in strange ways when axes is passed
See original GitHub issueDescribe the bug
Evoked.plot_topomap() produces unexpected behavior for me when I pass an Axes object via the axes keyword argument.
Steps to reproduce
import matplotlib
matplotlib.use('Qt5Agg')

import matplotlib.pyplot as plt
from mne.datasets import sample
from mne import read_evokeds

path = sample.data_path()
fname = path + '/MEG/sample/sample_audvis-ave.fif'

condition = 'Left Auditory'
evoked = read_evokeds(fname, condition=condition, baseline=(None, 0))

times = [0.05]

for colorbar_0, colorbar_1 in zip([False, True, True],
                                  [False, True, False]):
    fig, ax = plt.subplots(2, 2)
    evoked.plot_topomap(times, ch_type='mag', time_unit='s',
                        axes=ax[0, 0], show=True, colorbar=colorbar_0)
    evoked.plot_topomap(times, ch_type='mag', time_unit='s',
                        axes=ax[1, 0], show=True, colorbar=colorbar_1)
Expected results
Not to sure, actually! But certainly not what I do get 😃
Actual results
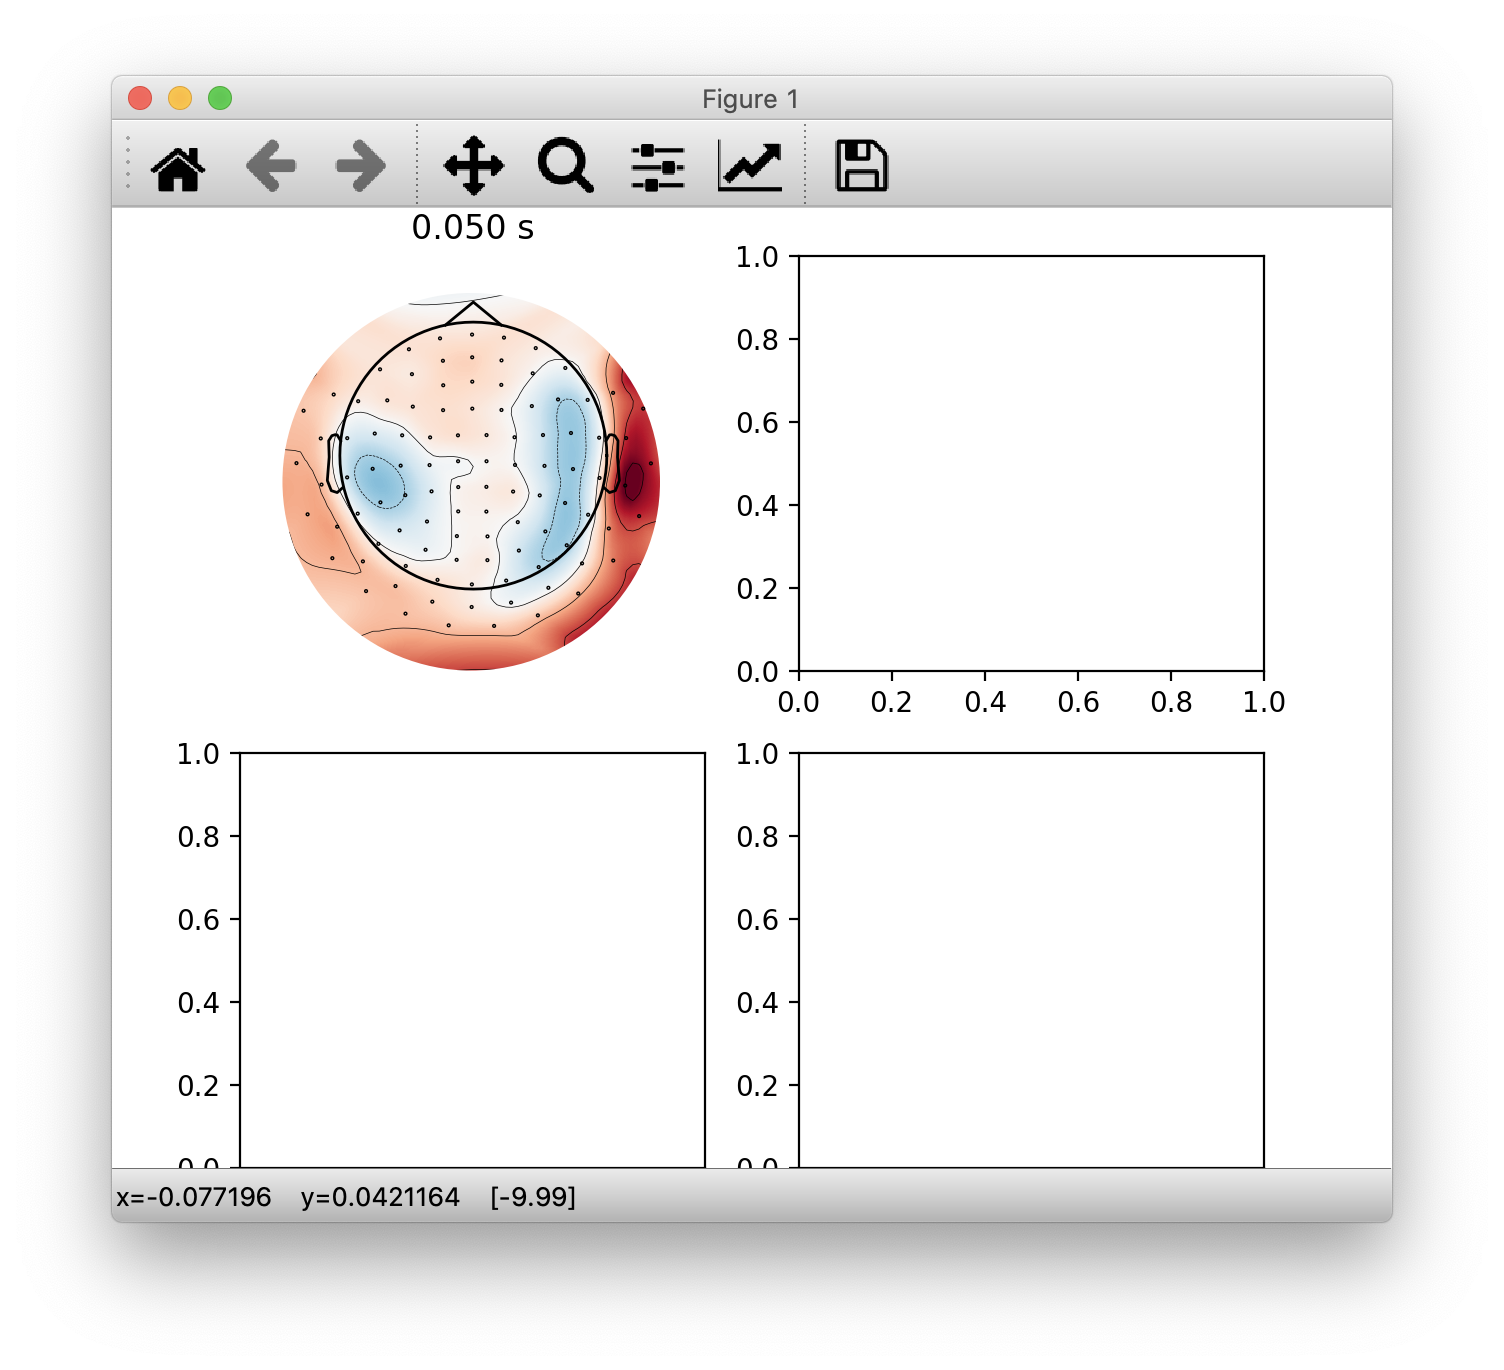
colorbar_0 = colorbar_1 = False
Two figures appear:
colorbar_0 = colorbar_1 = True
Two figures appear:
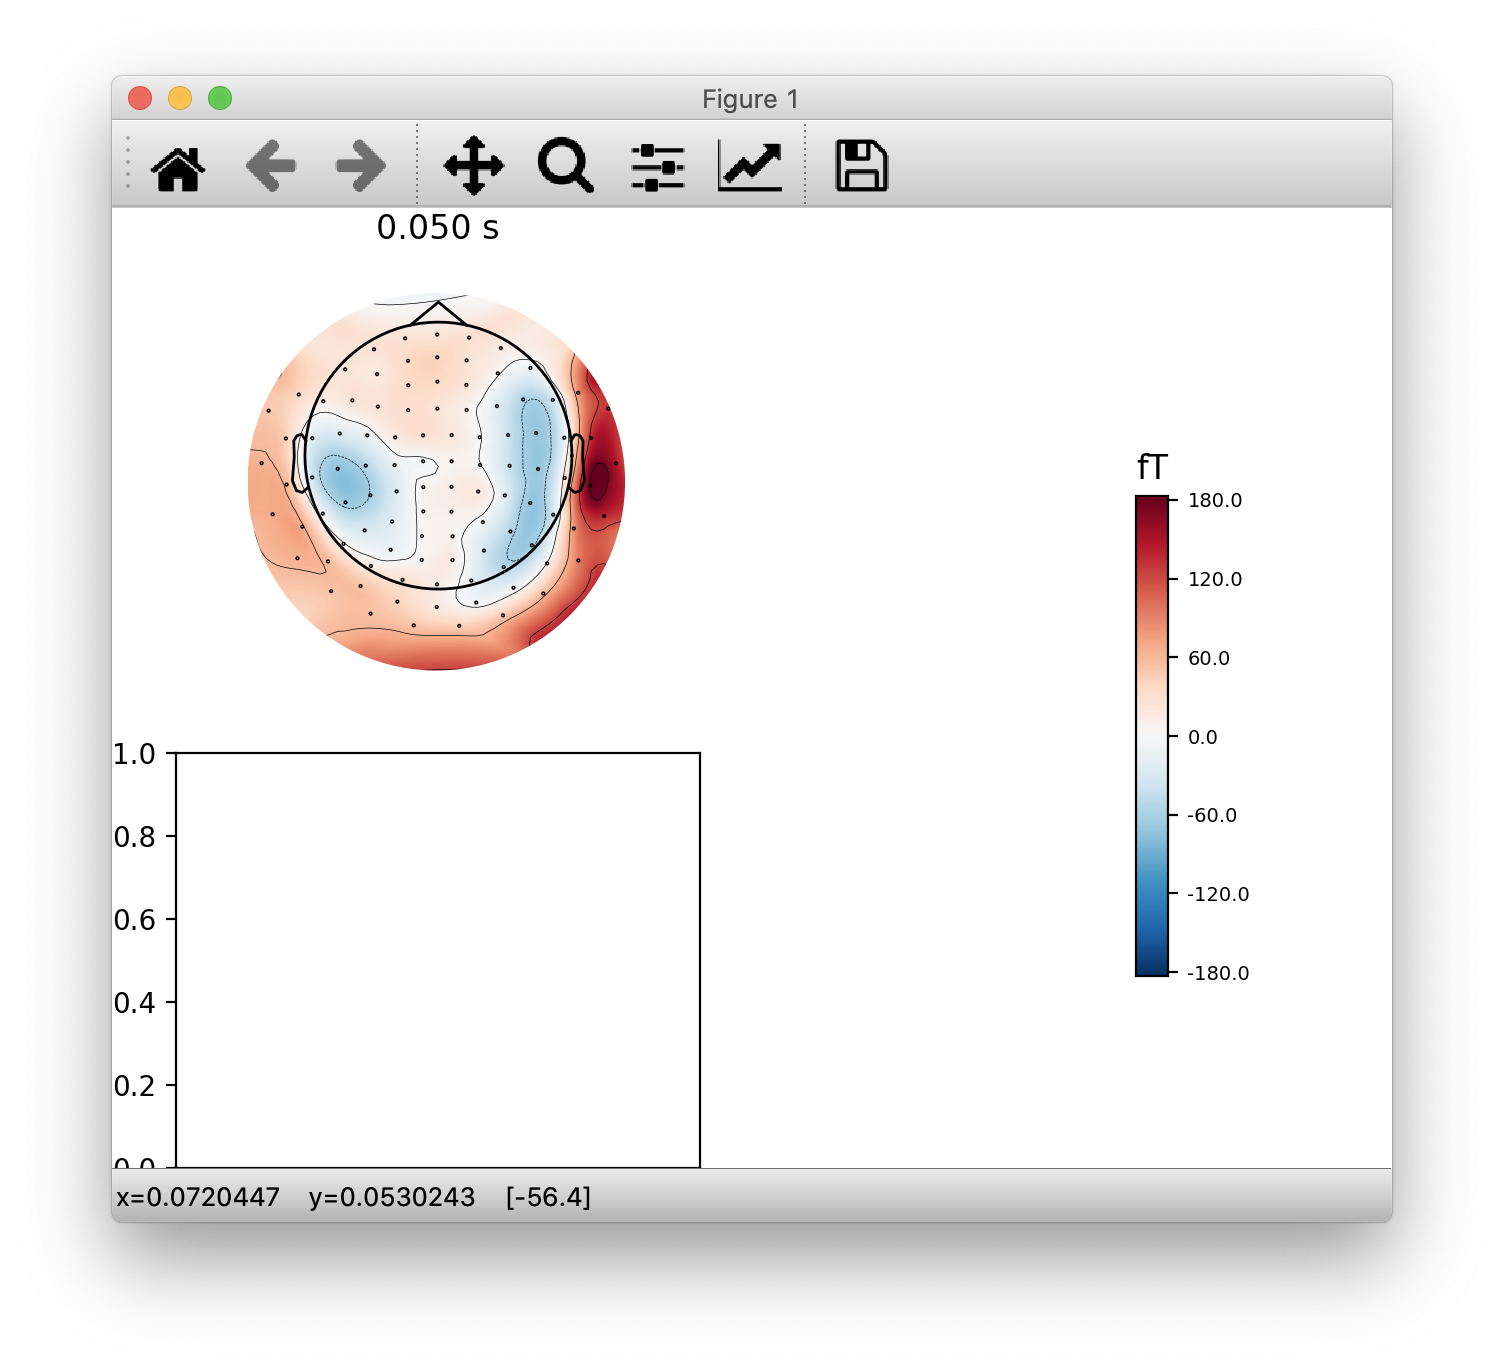
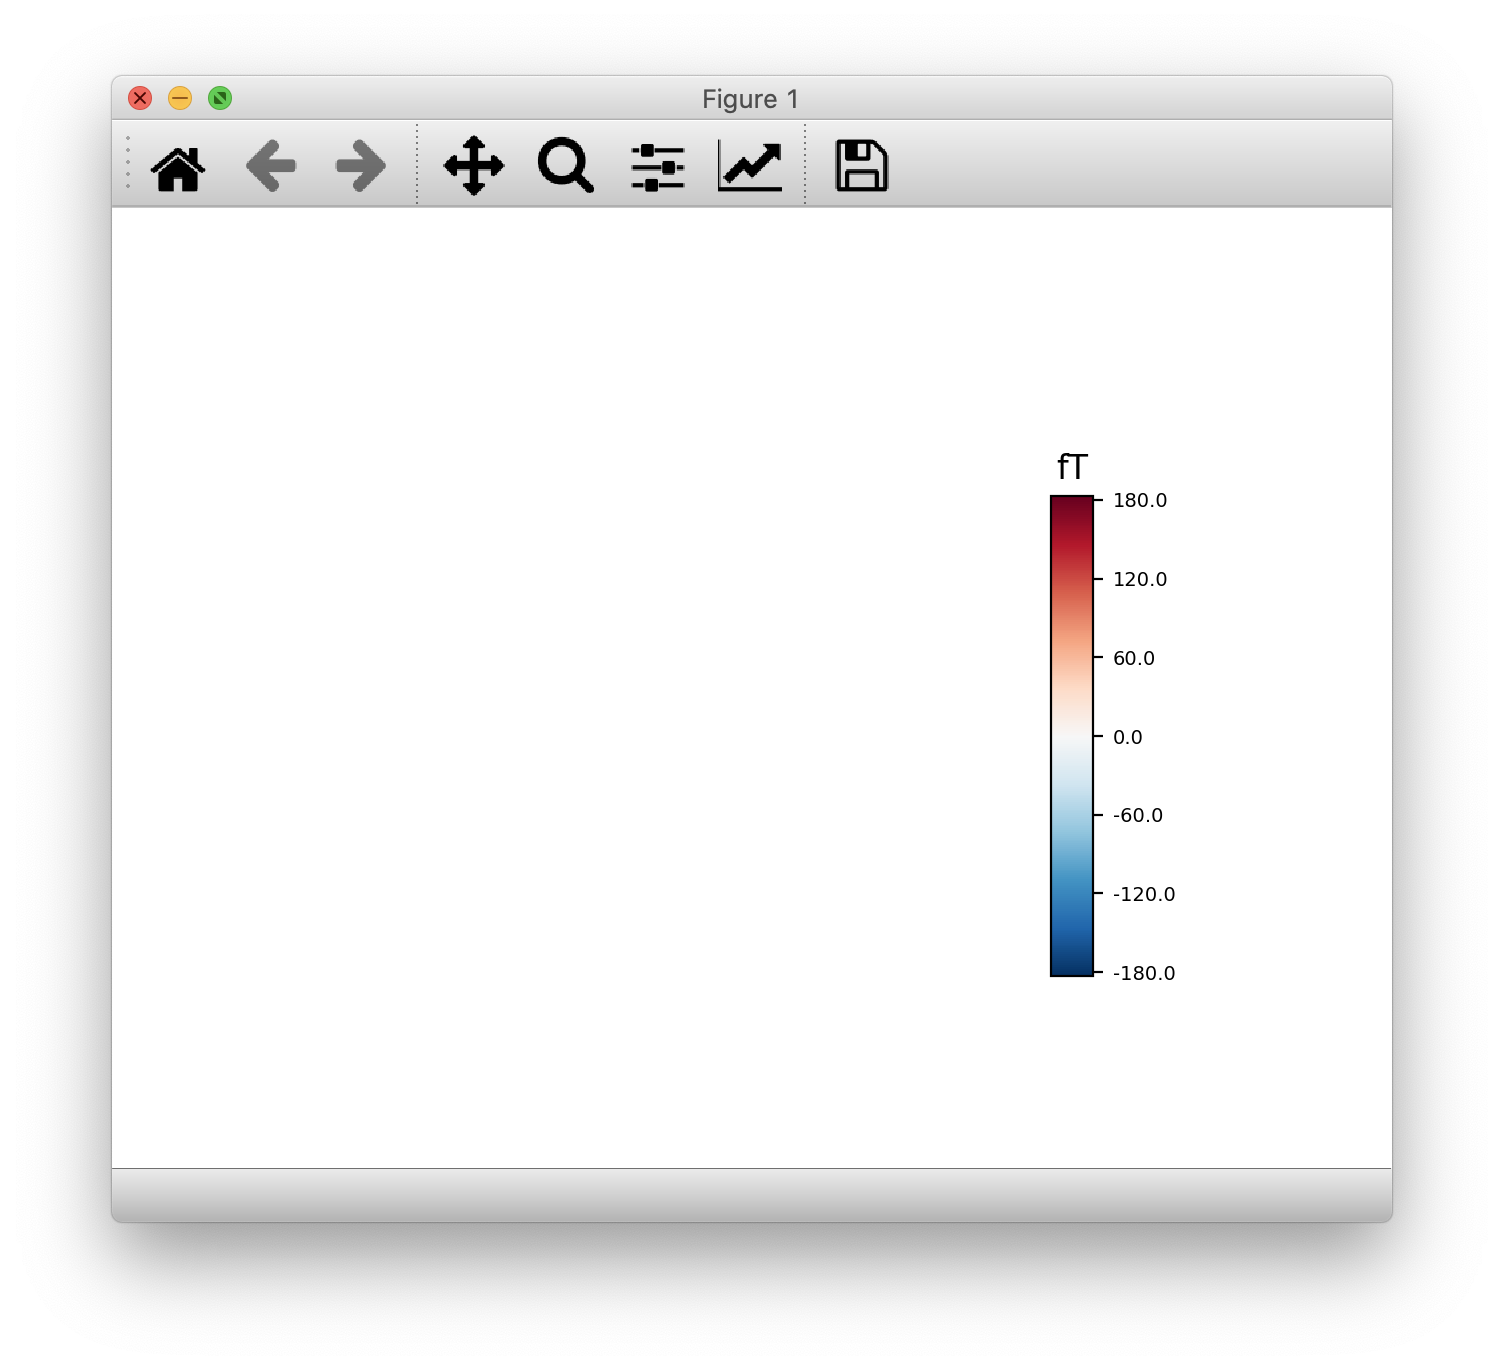
colorbar_0 =True; colorbar_1 = False
Two figures appear:


Additional information
Platform:      macOS-10.15.4-x86_64-i386-64bit
Python:        3.8.2 | packaged by conda-forge | (default, Mar 23 2020, 17:55:48)  [Clang 9.0.1 ]
Executable:    /Users/hoechenberger/miniconda3/envs/mne-dev-new/bin/python
CPU:           i386: 8 cores
Memory:        16.0 GB

mne:           0.21.dev0
numpy:         1.18.1 {blas=blas, lapack=blas}
scipy:         1.4.1
matplotlib:    3.2.1 {backend=Qt5Agg}

sklearn:       0.22.2.post1
numba:         Not found
nibabel:       3.0.2
cupy:          Not found
pandas:        1.0.3
dipy:          1.1.0
mayavi:        4.7.1 {qt_api=pyqt5, PyQt5=5.12.3}
pyvista:       0.24.0
vtk:           8.2.0
Issue Analytics
- State:

- Created 3 years ago
- Comments:7 (7 by maintainers)
 Top Results From Across the Web
Visualizing Evoked data — MNE 0.22.1 documentation
This tutorial shows the different visualization methods for Evoked objects. Page contents. Plotting signal traces. Plotting scalp topographies.
Read more >Visualize Evoked data — MNE 0.15.dev0 documentation
evoked is a list of evoked instances. You can read only one of the categories by passing the argument · condition to mne.read_evokeds()...
Read more >Visualize Evoked data — MNE 0.14.1 documentation
Notice that evoked is a list of evoked instances. You can read only one of the categories by passing the argument condition to...
Read more >colorbar in plot_topomap - Support & Discussions - MNE Forum
Hi, How do I add a color bar when plotting a eeg based topomap using mne.viz.plot_topomap? ... and not the plot_topomap() method of...
Read more > Top Related Medium Post
No results found
 Top Related StackOverflow Question
No results found
 Troubleshoot Live Code
Lightrun enables developers to add logs, metrics and snapshots to live code - no restarts or redeploys required.
Start Free Top Related Reddit Thread
No results found
 Top Related Hackernoon Post
No results found
 Top Related Tweet
No results found
 Top Related Dev.to Post
No results found
 Top Related Hashnode Post
No results found
@agramfort I don’t get missing topos (or duplicated figures) on windows in interactive backend. I was asking about inline because
show=Trueshows multi-topo figure too early, so some topos are missing then.to me the pb here is really about colorbar axes that is too magical now