
Stuck on an issue?
Lightrun Answers was designed to reduce the constant googling that comes with debugging 3rd party libraries. It collects links to all the places you might be looking at while hunting down a tough bug.
And, if you’re still stuck at the end, we’re happy to hop on a call to see how we can help out.
Color handling error for masked data since Matplotlib 3.1.0
See original GitHub issueI’m on Seaborn 0.9.0.
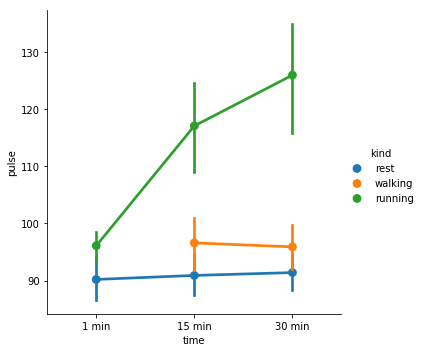
import seaborn as sns
df = sns.load_dataset("exercise")
# intentionally remove some points
df = df.drop(df.query("kind == 'walking' & time == '1 min'").index)
sns.catplot(x="time", y="pulse", hue="kind", kind='point', data=df)
With Matplotlib 3.0.2:
With Matplotlib 3.1.0:
---------------------------------------------------------------------------
ValueError                                Traceback (most recent call last)
<ipython-input-3-0ddfdcca1938> in <module>
      1 df = sns.load_dataset("exercise")
      2 df = df.drop(df.query("kind == 'walking' & time == '1 min'").index)
----> 3 sns.catplot(x="time", y="pulse", hue="kind", kind='point', data=df)

/usr/local/lib/python3.7/site-packages/seaborn/categorical.py in catplot(x, y, hue, data, row, col, col_wrap, estimator, ci, n_boot, units, order, hue_order, row_order, col_order, kind, height, aspect, orient, color, palette, legend, legend_out, sharex, sharey, margin_titles, facet_kws, **kwargs)
   3753
   3754     # Draw the plot onto the facets
-> 3755     g.map_dataframe(plot_func, x, y, hue, **plot_kws)
   3756
   3757     # Special case axis labels for a count type plot

/usr/local/lib/python3.7/site-packages/seaborn/axisgrid.py in map_dataframe(self, func, *args, **kwargs)
    818
    819             # Draw the plot
--> 820             self._facet_plot(func, ax, args, kwargs)
    821
    822         # Finalize the annotations and layout

/usr/local/lib/python3.7/site-packages/seaborn/axisgrid.py in _facet_plot(self, func, ax, plot_args, plot_kwargs)
    836
    837         # Draw the plot
--> 838         func(*plot_args, **plot_kwargs)
    839
    840         # Sort out the supporting information

/usr/local/lib/python3.7/site-packages/seaborn/categorical.py in pointplot(x, y, hue, data, order, hue_order, estimator, ci, n_boot, units, markers, linestyles, dodge, join, scale, orient, color, palette, errwidth, capsize, ax, **kwargs)
   3338         ax = plt.gca()
   3339
-> 3340     plotter.plot(ax)
   3341     return ax
   3342

/usr/local/lib/python3.7/site-packages/seaborn/categorical.py in plot(self, ax)
   1809     def plot(self, ax):
   1810         """Make the plot."""
-> 1811         self.draw_points(ax)
   1812         self.annotate_axes(ax)
   1813         if self.orient == "h":

/usr/local/lib/python3.7/site-packages/seaborn/categorical.py in draw_points(self, ax)
   1805                            c=point_colors, edgecolor=point_colors,
   1806                            linewidth=mew, marker=marker, s=markersize,
-> 1807                            zorder=z)
   1808
   1809     def plot(self, ax):

/usr/local/lib/python3.7/site-packages/matplotlib/__init__.py in inner(ax, data, *args, **kwargs)
   1587     def inner(ax, *args, data=None, **kwargs):
   1588         if data is None:
-> 1589             return func(ax, *map(sanitize_sequence, args), **kwargs)
   1590
   1591         bound = new_sig.bind(ax, *args, **kwargs)

/usr/local/lib/python3.7/site-packages/matplotlib/axes/_axes.py in scatter(self, x, y, s, c, marker, cmap, norm, vmin, vmax, alpha, linewidths, verts, edgecolors, plotnonfinite, **kwargs)
   4488                 offsets=offsets,
   4489                 transOffset=kwargs.pop('transform', self.transData),
-> 4490                 alpha=alpha
   4491                 )
   4492         collection.set_transform(mtransforms.IdentityTransform())

/usr/local/lib/python3.7/site-packages/matplotlib/collections.py in __init__(self, paths, sizes, **kwargs)
    881         """
    882
--> 883         Collection.__init__(self, **kwargs)
    884         self.set_paths(paths)
    885         self.set_sizes(sizes)

/usr/local/lib/python3.7/site-packages/matplotlib/collections.py in __init__(self, edgecolors, facecolors, linewidths, linestyles, capstyle, joinstyle, antialiaseds, offsets, transOffset, norm, cmap, pickradius, hatch, urls, offset_position, zorder, **kwargs)
    126         self._hatch_color = mcolors.to_rgba(mpl.rcParams['hatch.color'])
    127         self.set_facecolor(facecolors)
--> 128         self.set_edgecolor(edgecolors)
    129         self.set_linewidth(linewidths)
    130         self.set_linestyle(linestyles)

/usr/local/lib/python3.7/site-packages/matplotlib/collections.py in set_edgecolor(self, c)
    726         """
    727         self._original_edgecolor = c
--> 728         self._set_edgecolor(c)
    729
    730     def set_alpha(self, alpha):

/usr/local/lib/python3.7/site-packages/matplotlib/collections.py in _set_edgecolor(self, c)
    710         except AttributeError:
    711             pass
--> 712         self._edgecolors = mcolors.to_rgba_array(c, self._alpha)
    713         if set_hatch_color and len(self._edgecolors):
    714             self._hatch_color = tuple(self._edgecolors[0])

/usr/local/lib/python3.7/site-packages/matplotlib/colors.py in to_rgba_array(c, alpha)
    284     result = np.empty((len(c), 4), float)
    285     for i, cc in enumerate(c):
--> 286         result[i] = to_rgba(cc, alpha)
    287     return result
    288

/usr/local/lib/python3.7/site-packages/matplotlib/colors.py in to_rgba(c, alpha)
    175         rgba = None
    176     if rgba is None:  # Suppress exception chaining of cache lookup failure.
--> 177         rgba = _to_rgba_no_colorcycle(c, alpha)
    178         try:
    179             _colors_full_map.cache[c, alpha] = rgba

/usr/local/lib/python3.7/site-packages/matplotlib/colors.py in _to_rgba_no_colorcycle(c, alpha)
    236         # float)` and `np.array(...).astype(float)` all convert "0.5" to 0.5.
    237         # Test dimensionality to reject single floats.
--> 238         raise ValueError("Invalid RGBA argument: {!r}".format(orig_c))
    239     # Return a tuple to prevent the cached value from being modified.
    240     c = tuple(c.astype(float))

ValueError: Invalid RGBA argument: masked
Issue Analytics
- State:

- Created 4 years ago
- Comments:10 (5 by maintainers)
 Top Results From Across the Web
API Changes for 3.1.0 — Matplotlib 3.6.2 documentation
Support for passing single-letter colors (one of "rgbcmykw") as UPPERCASE characters is deprecated; these colors will become case-sensitive (lowercase) after ...
Read more >Image Masked — Matplotlib 3.1.0 documentation
Image Masked¶. imshow with masked array input and out-of-range colors. The second subplot illustrates the use of BoundaryNorm to get a filled contour...
Read more >matplotlib.pyplot.hist — Matplotlib 3.1.0 documentation
Multiple data can be provided via x as a list of datasets of potentially different length ([x0, x1, . ... Masked arrays are...
Read more >matplotlib.pyplot.show — Matplotlib 3.1.0 documentation
When running in ipython with its pylab mode, display all figures and ... Contour plot of irregularly spaced data ... Box plots with...
Read more >GitHub statistics for 3.1.0 (May 18, 2019) - Matplotlib
PR #14080: Backport PR #14069 on branch v3.1.x (Don't try to use the colorbar formatter to format RGBA data.).
Read more > Top Related Medium Post
No results found
 Top Related StackOverflow Question
No results found
 Troubleshoot Live Code
Lightrun enables developers to add logs, metrics and snapshots to live code - no restarts or redeploys required.
Start Free Top Related Reddit Thread
No results found
 Top Related Hackernoon Post
No results found
 Top Related Tweet
No results found
 Top Related Dev.to Post
No results found
 Top Related Hashnode Post
No results found
3.1.1 with the relevant bugfix has just been released.
I am still problem in using catplot with poinplot and hue. Matplotlib 3.1.1 Seaborn 0.9.0 Anaconda Python 3.6.7
The error I got is “ValueError: ‘c’ argument has 8 elements, which is not acceptable for use with ‘x’ with size 0, ‘y’ with size 0.”
Please suggest some fix.