
Stuck on an issue?
Lightrun Answers was designed to reduce the constant googling that comes with debugging 3rd party libraries. It collects links to all the places you might be looking at while hunting down a tough bug.
And, if you’re still stuck at the end, we’re happy to hop on a call to see how we can help out.
FacetGrid legend missing colors in key
See original GitHub issueCode Sample, a copy-pastable example if possible
import pandas as pd
import matplotlib.pyplot as plt
import matplotlib.patches as patches
import seaborn as sns
sns.set_style('whitegrid')

test = sns.load_dataset("tips")
g = sns.FacetGrid(test,
                  col="sex",
                  hue="smoker",
                  size=4, aspect=1)
g = (g.map(sns.pointplot, "time", "total_bill").add_legend())
Problem description
For some reason I cannot get the colors from the plot to appear in the key:

Here is my setup:
INSTALLED VERSIONS
------------------
commit: None
python: 3.5.2.final.0
python-bits: 64
OS: Darwin
OS-release: 15.0.0
machine: x86_64
processor: i386
byteorder: little
LC_ALL: None
LANG: en_US.UTF-8
LOCALE: en_US.UTF-8
pandas: 0.19.0 seaborn: 0.7.1 matplotlib: 2.0.0 jupyter: 1.0.0 jupyter_client: 4.4.0 jupyter_console: 5.0.0 jupyter_core: 4.2.0
I was on a much earlier version of Matplotlib (1.5.1), and tried upgrading to 2.0 but that did not fix the issue.
Issue Analytics
- State:

- Created 6 years ago
- Reactions:2
- Comments:16 (3 by maintainers)
 Top Results From Across the Web
Changing legend labels on seaborn FacetGrid with barplot ...
You can do this with FacetGrid's add_legend method. When calling add_legend , the legend_data parameter maps labels to color patches.
Read more >seaborn.FacetGrid — seaborn 0.12.1 documentation - PyData |
This uses color to resolve elements on a third dimension, but only draws subsets on top of each other and will not tailor...
Read more >How to change Seaborn legends font size, location and color?
We use matplotlib.pyplot.legend() function from matplotlib library and pass the bbox_to_anchor parameter which allows us to pass an (x,y) tuple ...
Read more >Part2 | How To Customize ggplot2 (Full R code) - R-Statistics.co
In case you want to show the legend for color ( State ) before size ( Density ), it can be done with...
Read more >seaborn.catplot — seaborn 0.9.0 documentation
Figure-level interface for drawing categorical plots onto a FacetGrid. ... If True and there is a hue variable, draw a legend on the...
Read more > Top Related Medium Post
No results found
 Top Related StackOverflow Question
No results found
 Troubleshoot Live Code
Lightrun enables developers to add logs, metrics and snapshots to live code - no restarts or redeploys required.
Start Free Top Related Reddit Thread
No results found
 Top Related Hackernoon Post
No results found
 Top Related Tweet
No results found
 Top Related Dev.to Post
No results found
 Top Related Hashnode Post
No results found
@kning It is very explicit but it works.There is obviously something wrong with getting the patches from the FacetGrid object.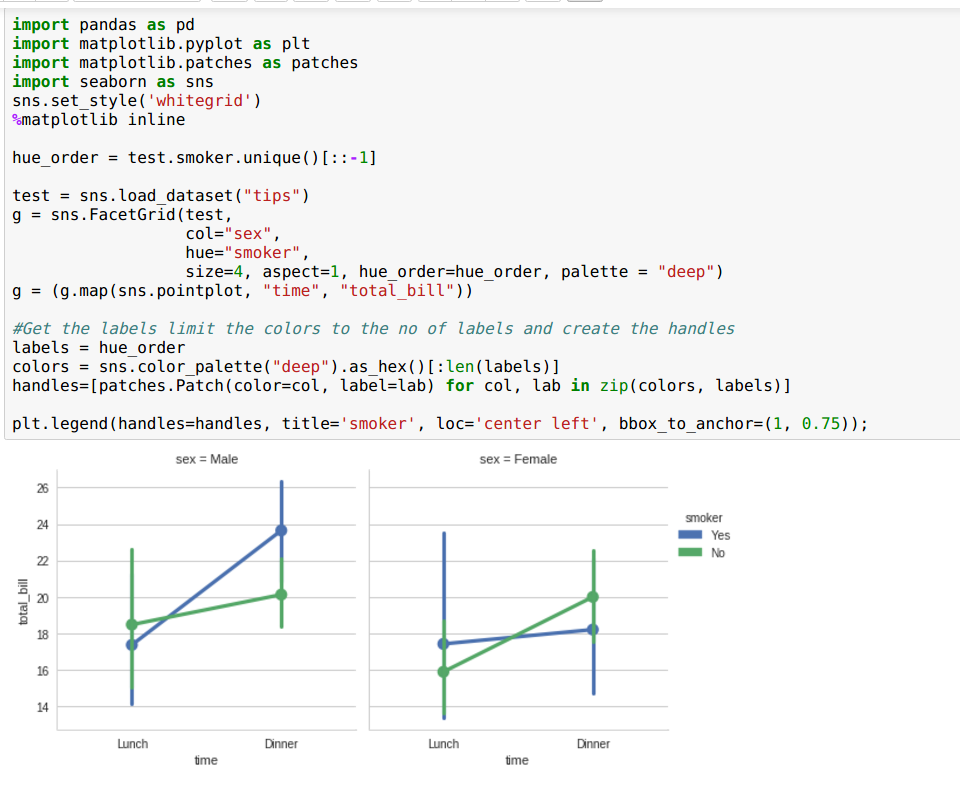
Is there a solution for this? Can
factorplotbe used with a custom map function like inFacetGrid?. I have a custom histogram function for plotting on each facet. It plots the data fine but I have the same issue with the legend missing the colors.