
Lightrun Answers was designed to reduce the constant googling that comes with debugging 3rd party libraries. It collects links to all the places you might be looking at while hunting down a tough bug.
And, if you’re still stuck at the end, we’re happy to hop on a call to see how we can help out.
Feature request: allow non-symmetrical violint plots
See original GitHub issueHi!
I love violinplots, but I always found that it might not be needed to plot them as symmetrical, the information is doubly present for no real reason.
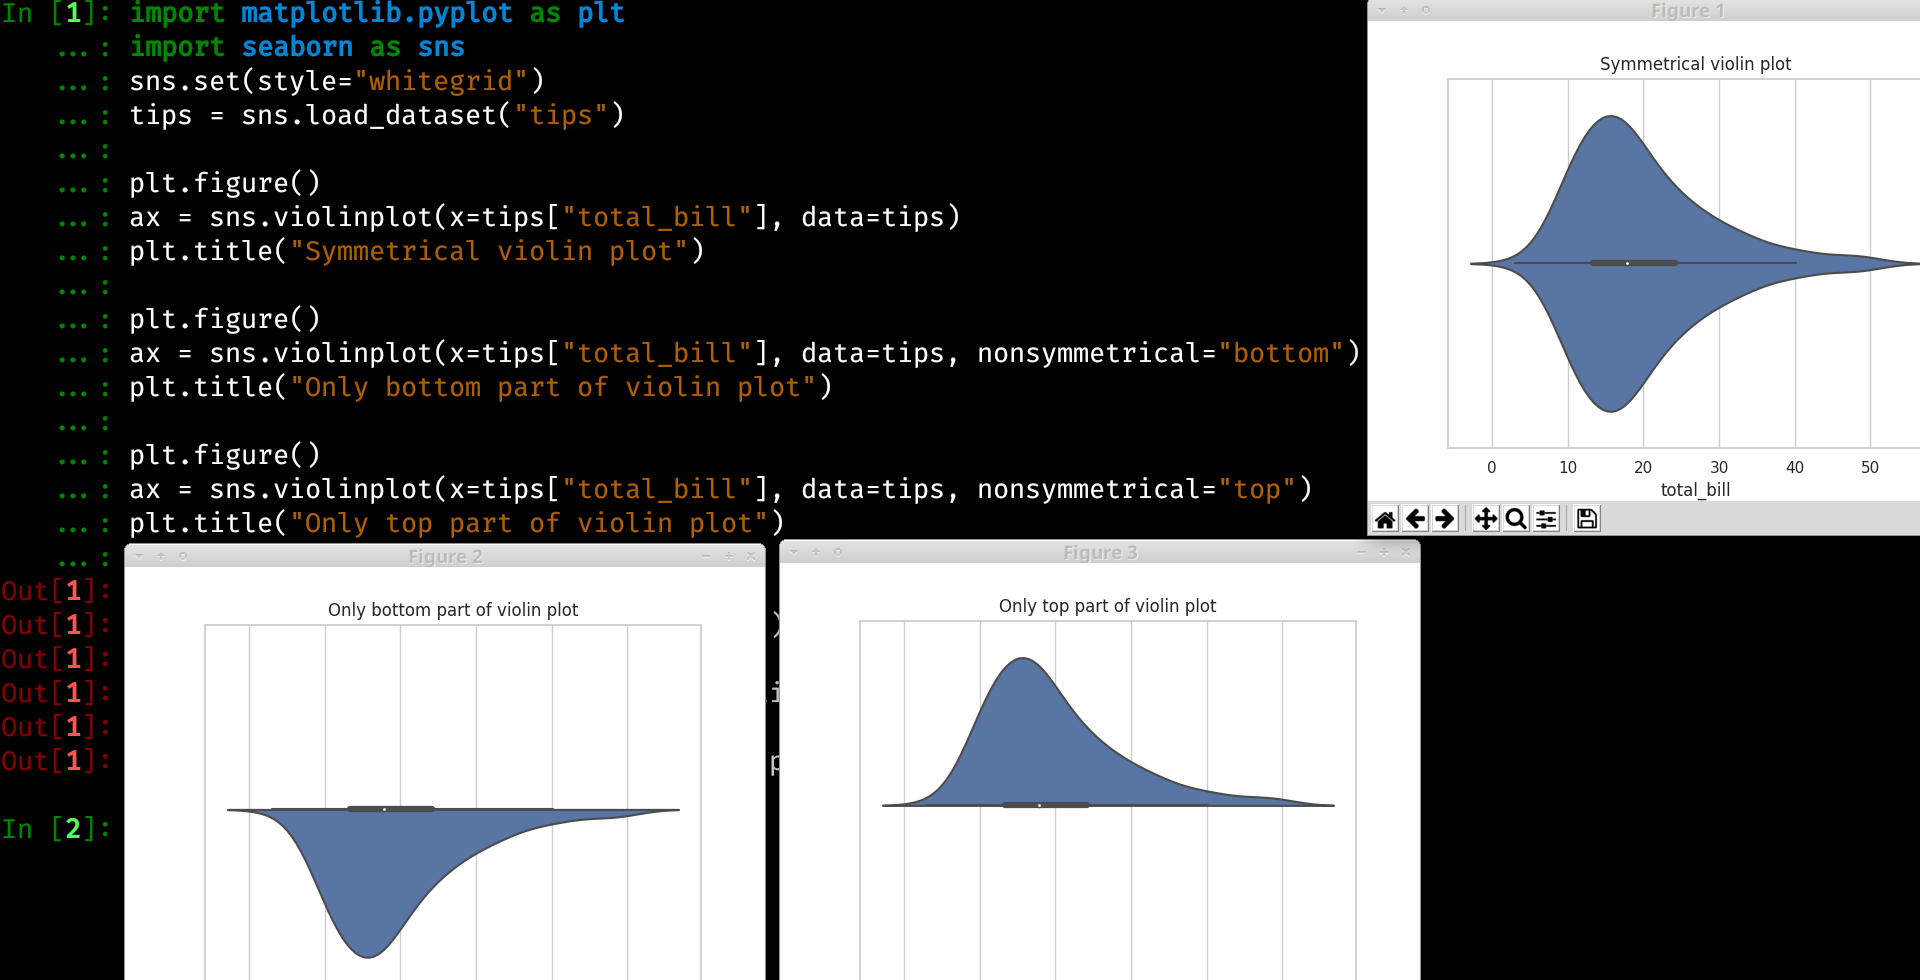
I will send a tiny pull request that adds a key-word argument nonsymmetrical to seaborn.violint, it can be False (the default), or "left" or "right" (or "bottom" or "top") to allow to only plot half of the violin.
Here are two tiny demos, for a single violin or more violins, for horizontal (top/bottom) or vertical (left/right) cases:

Issue Analytics
- State:

- Created 5 years ago
- Comments:5 (1 by maintainers)
 Top Related StackOverflow Question
 Troubleshoot Live Code
 Top Related Reddit Thread
 Top Related Hackernoon Post
 Top Related Tweet
 Top Related Dev.to Post
 Top Related Hashnode Post
kind='kde'tosns.catplotwould be perfect. We have had multiple requests from our clients to drop the symmetry as it can be off-putting. I think it is more important than you realise, @mwaskom, imho.For what it’s worth, I’m looking for half-violin plots for Raincloud plots. That package has its own implementation but… it’s mainly a copy of your code.
You can jigger seaborn to do half-violins by adding fake off-scale data to yourset and abusing the
hueparameter, but that’s pretty gross.A more useful alternative, though, might be to add
kind='kde'tosns.catplot— really, a violin plot is just two kdeplots pasted together.Thoughts?