
Lightrun Answers was designed to reduce the constant googling that comes with debugging 3rd party libraries. It collects links to all the places you might be looking at while hunting down a tough bug.
And, if you’re still stuck at the end, we’re happy to hop on a call to see how we can help out.
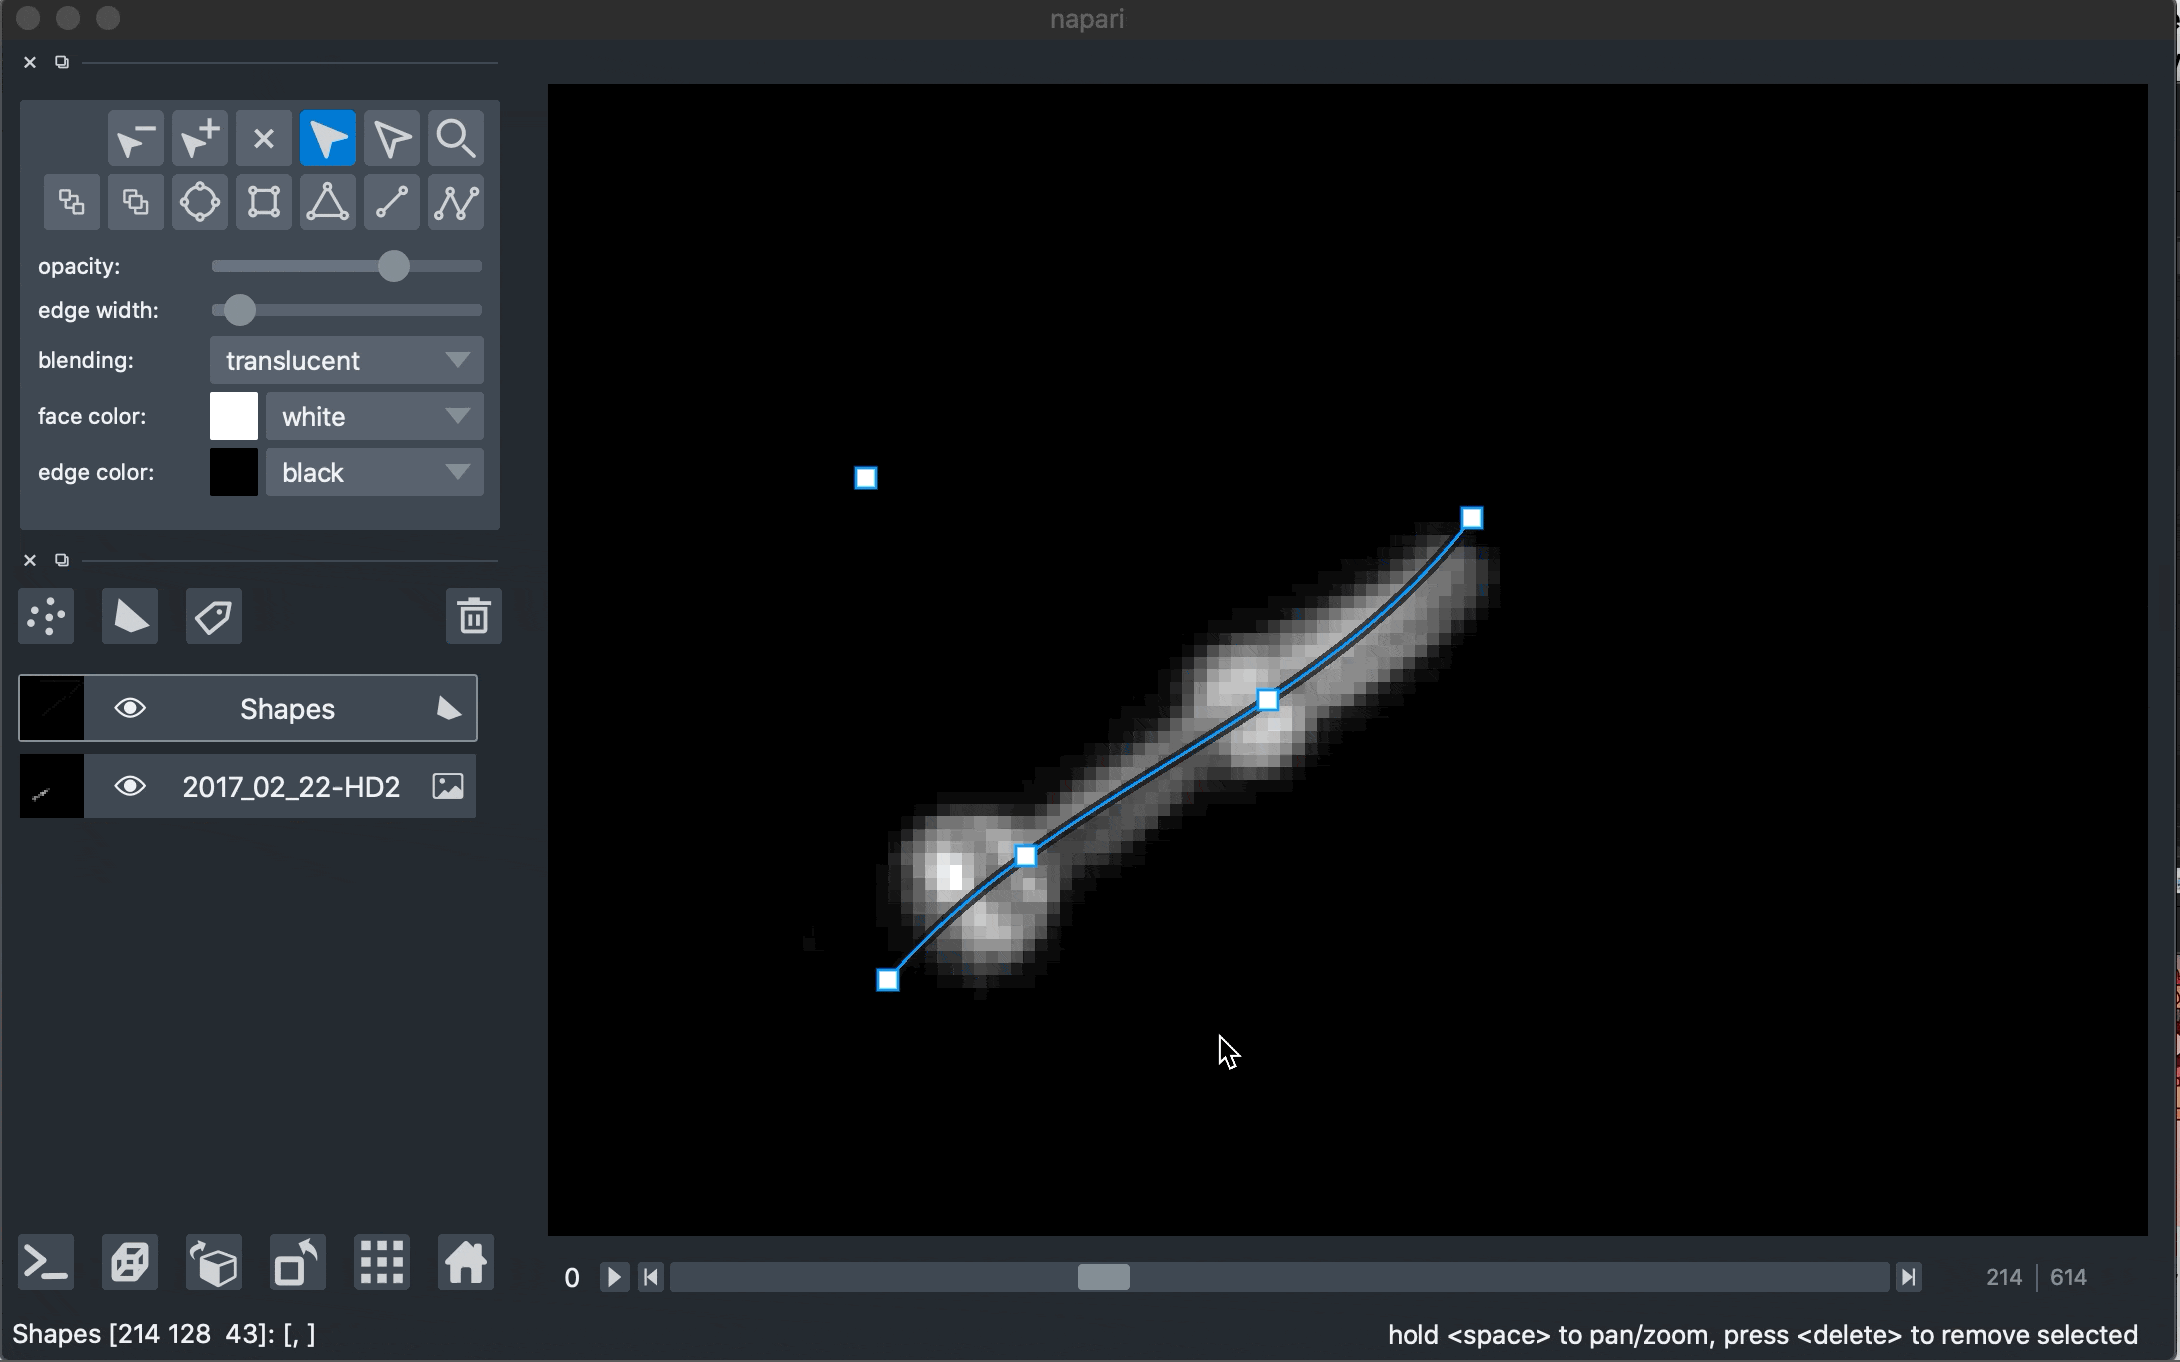
Optional spline interpolation on shapes
See original GitHub issue🚀 Feature
Shapes could have the option of a smooth interpolation between points.
Motivation
In my image analysis pipeline, I make use of smooth curves which interpolate through points. This functionality is also available in e.g. FIJI/ImageJ.
Pitch
My initial idea is that in addition to the opacity/edge width sliders and the blending/face/edge color dropdowns, there could be a “smooth” checkbox which would enable cubic interpolation when checked, and linear interpolation when unchecked. Alternatively, there could be a dropdown menu with different interpolation options.
Alternatives
These smooth versions could be their own shapes? That seems less elegant though.
Additional context
This interpolation is actually quite easy thanks to SciPy. I made a rough proof-of-concept by calling _set_meshes with the interpolated data within _update_displayed_data in napari/layers/shapes/_shapes_models/path.py:
def _update_displayed_data(self):
        """Update the data that is to be displayed."""
        # For path connect every all data

        if self.data_displayed.shape[0] > 2:
            distance = np.cumsum(np.sqrt(np.sum(np.diff(self.data_displayed[:-1,:], axis=0)**2, axis=1 )) )
            distance = np.insert(distance, 0, 0)/distance[-1]

            # the number of sampled data points might need to be carefully thought
            # about (might need to change with image scale?)
            alpha = np.linspace(0, 1, 75)

            spl = CubicSpline(distance, self.data_displayed[:-1, :])
            interp_pts = spl(alpha)

            self._set_meshes(interp_pts, face=False, closed=False)
        else:
            self._set_meshes(self.data_displayed, face=False, closed=False)

        self._box = create_box(self.data_displayed)

        data_not_displayed = self.data[:, self.dims_not_displayed]
        self.slice_key = np.round(
            [
                np.min(data_not_displayed, axis=0),
                np.max(data_not_displayed, axis=0),
            ]
        ).astype('int')
I recorded a short video of this in action
I’m not really familiar with napari’s architecture, so this is all I’ve done so far, but if the above proposal sounds interesting, I’d be happy to keep working on this.
Issue Analytics
- State:

- Created 3 years ago
- Reactions:3
- Comments:7 (5 by maintainers)
 Top Related StackOverflow Question
 Troubleshoot Live Code
 Top Related Reddit Thread
 Top Related Hackernoon Post
 Top Related Tweet
 Top Related Dev.to Post
 Top Related Hashnode Post
Excited that this has some interest!
@tlambert03 I do have code that can measure along these curves - I use them to make measurements in my microscopy. Here’s the function I’m using to do it.
Basically i just use
np.map_coordinatesto sample the image along the points of the spline.If you want the avg. intensity around the shape, it does get a bit more complex (although there might be a much easier way than what I’m doing!). I think if the shape has been given width through the UI it makes sense to do.
For this, I just calculate the normal lines at each sampled point along the curve, then use
np.map_coordinatesto measure under those, resulting in a measurement rectangle (which is essentially a “straightened” image along the curve). Then you can flatten it with the average. In that sample code, I actually weight the average around a gaussian centered on the curve, but that is specific to my needs, and I’m guessing is needlessly complex for this package.See here for an explanation of what might be required to finish the work https://github.com/napari/napari/pull/2345#issuecomment-955157371