
Lightrun Answers was designed to reduce the constant googling that comes with debugging 3rd party libraries. It collects links to all the places you might be looking at while hunting down a tough bug.
And, if you’re still stuck at the end, we’re happy to hop on a call to see how we can help out.
Low performance
See original GitHub issueExpected behavior
Better performance
Actual behavior
Low performance
Steps to reproduce
Write and flush packets. I see REALLY big % on time spent for example from: invokeWriteAndFlush invokeWrite0 -> writePromiseCombiner invokeFlush0 -> writevAddresses
Minimal yet complete reproducer code (or URL to code)
Normal netty.
Netty version
4.1.75 (is there a difference in performance between 5.0?)
JVM version (e.g. java -version)
java version “17.0.1” 2021-10-19 LTS Java™ SE Runtime Environment (build 17.0.1+12-LTS-39) Java HotSpot™ 64-Bit Server VM (build 17.0.1+12-LTS-39, mixed mode, sharing)
OS version (e.g. uname -a)
Linux ns31343129 4.19-ovh-xxxx-std-ipv6-64 #1818198 SMP Wed Jun 16 15:21:25 UTC 2021 x86_64 GNU/Linux
Issue Analytics
- State:

- Created a year ago
- Comments:31 (13 by maintainers)
 Top Related StackOverflow Question
 Troubleshoot Live Code
 Top Related Reddit Thread
 Top Related Hackernoon Post
 Top Related Tweet
 Top Related Dev.to Post
 Top Related Hashnode Post
I use netty in Minecraft servers, fork of Spigot and fork of BungeeCord https://github.com/SpigotMC/BungeeCord. you run with many cores? Yes, I run with many cores. do you have DuplexChannelHandlers in your pipeling? I don’t think so. are you using HTTP? I don’t think so. which machine you run the benchmark(s)? Which profiler you mean? I use https://spark.lucko.me/ which load generator? I don’t understand.
In this Spigot’s fork you can see more about how the pipeline is constructed: https://github.com/CobbleSword/NachoSpigot/blob/master/NachoSpigot-Server/src/main/java/dev/cobblesword/nachospigot/protocol/MinecraftPipeline.java https://github.com/CobbleSword/NachoSpigot/blob/master/NachoSpigot-Server/src/main/java/net/minecraft/server/NetworkManager.java https://github.com/CobbleSword/NachoSpigot/search?q=netty
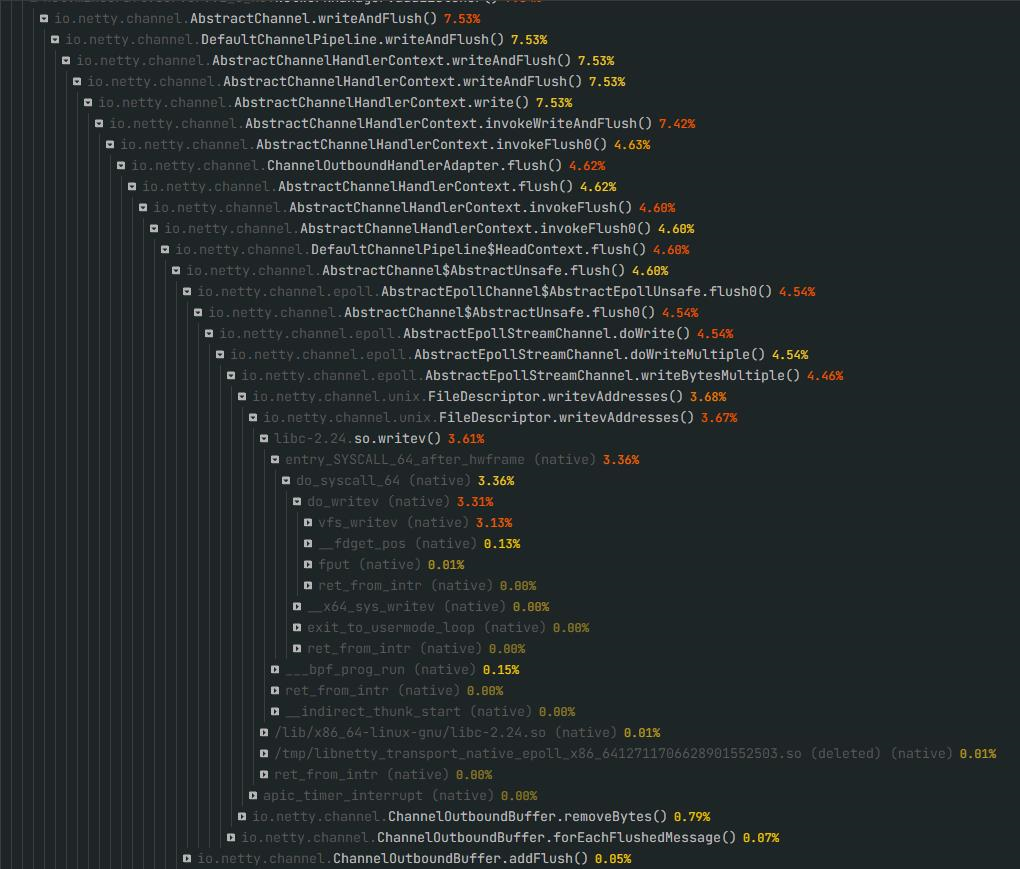
2% of cpu is quite a lot, when you have 100% of cpu usage, you will have 98% after correcting this part to 0%. On the profiler from today it shows 2.30%. Another screenshot that might be useful: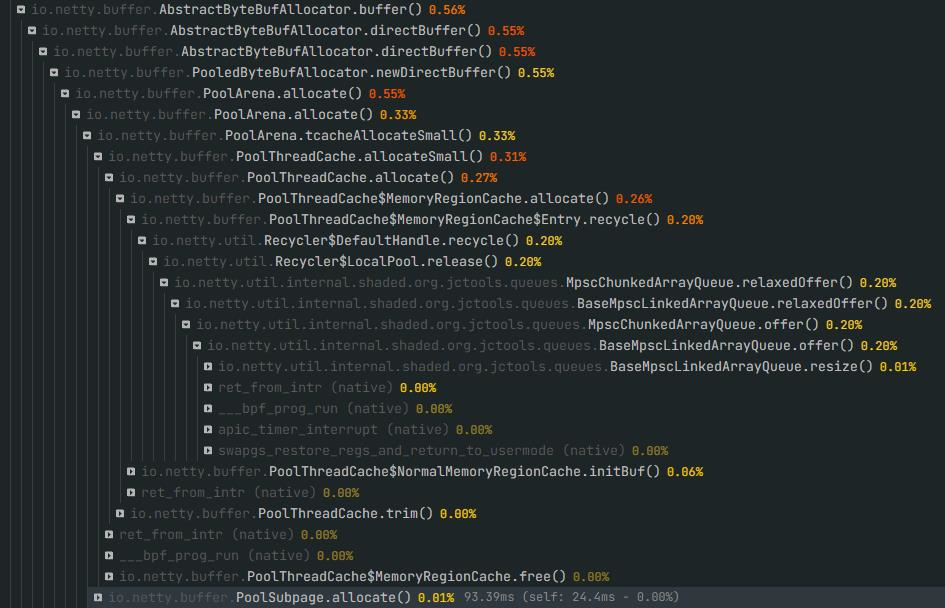 Here you have 7.5% for example:
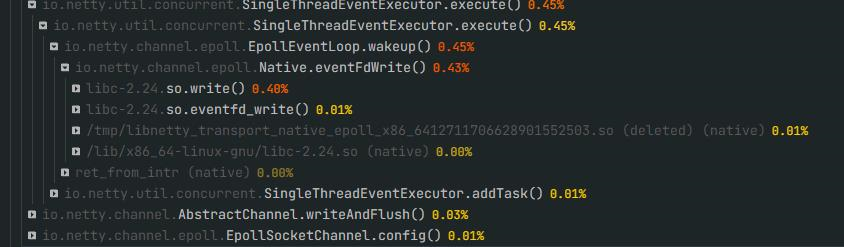
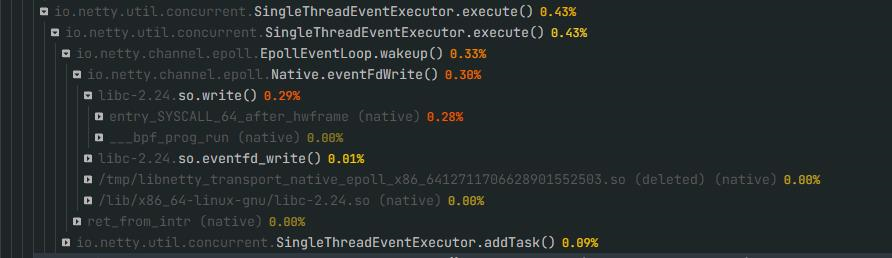
 And another 2% here:
 Or 2.6% here:
 Another screenshots:
Combined it takes around 16% of cpu from this particular process.