
Lightrun Answers was designed to reduce the constant googling that comes with debugging 3rd party libraries. It collects links to all the places you might be looking at while hunting down a tough bug.
And, if you’re still stuck at the end, we’re happy to hop on a call to see how we can help out.
Visual Studio Code Auto Attach debugging not working with NestJS
See original GitHub issueBug Report
Reference: nestjs/nest#5590.
Current behavior
In a new nx project with nest preset, after setting a breakpoint somewhere and configuring Visual Studio Code’s Debug -> JavaScript -> Auto Attach Filter with several configurations, the application will not start and the breakpoint will not hit when running nx serve. It does not matter wether I enable or disable Debug -> JavaScript -> Use Preview.
Different values for the auto attach setting have the following results:
always

smart

onlyWithFlag
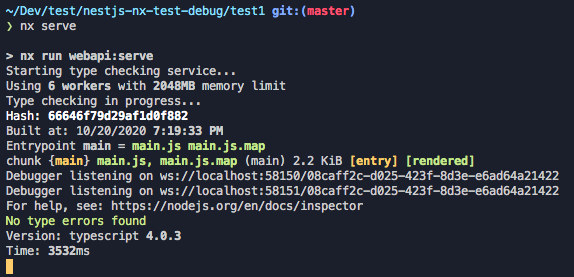
disabled
Expected behavior
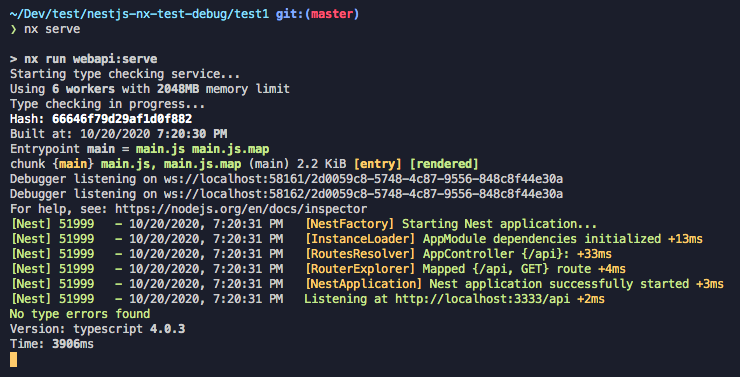
The application should start and breakpoints should break processing. This was working up until recently. I am not entirely sure, but I believe up until at least 1 month ago it was working fine.
Having a project with just NestJS does work with Visual Studio Code’s auto attach debugging.
Environment
Nest version: 7.4.4


For Tooling issues:
- Node version: 14.13.1
- Platform: Mac

Others:

    "@nrwl/cli": "10.3.1",
    "@nrwl/eslint-plugin-nx": "10.3.1",
    "@nrwl/jest": "10.3.1",
    "@nrwl/nest": "10.3.1",
    "@nrwl/node": "10.3.1",
Issue Analytics
- State:

- Created 3 years ago
- Reactions:2
- Comments:7
 Top Related StackOverflow Question
 Troubleshoot Live Code
 Top Related Reddit Thread
 Top Related Hackernoon Post
 Top Related Tweet
 Top Related Dev.to Post
 Top Related Hashnode Post
I’m facing the same issue with @nrwl/node v11.0.2, however, I might’ve found some additional information.
It possibly has something to do with the inspect argument being passed down to the child process, see this StackOverflow question.
https://github.com/nrwl/nx/blob/075fe9446b16e4e5c8bba78e4cb85888e5e50fe9/packages/node/src/builders/execute/execute.impl.ts#L75-L77
Since the whole
nx serveprocess was being debugged, setting the “inspect” option tofalseinworkspace.jsonworked for me, as the spawned child process would still be able to break on any breakpoints:Afterwards, using both the
JavaScript Debug Terminalas well as the Auto Attach Feature with the following patterns worked for me:Just switch to “command prompt” to run the command will work. “powershell” won’t work.