
Stuck on an issue?
Lightrun Answers was designed to reduce the constant googling that comes with debugging 3rd party libraries. It collects links to all the places you might be looking at while hunting down a tough bug.
And, if you’re still stuck at the end, we’re happy to hop on a call to see how we can help out.
Numpy eigh crashes - unexpected results
See original GitHub issueI have an adjacency matrix of a graph and then I build the Laplacian matrix of the graph (https://en.wikipedia.org/wiki/Laplacian_matrix) as L = D - A, where D is the degree matrix and A is the adjacency matrix of the graph.
Data: https://file.io/StnNei0y7vxP
Code:
from scipy.io import loadmat
import numpy as np
import matplotlib.pyplot as plt
from scipy import stats

X = np.array(loadmat('/Users/sera/Downloads/113922_TCS_Glasser360.mat')['TCS'])

# build adjacency
X = stats.zscore(X, axis=1)
u, l = 0.0, 0.0
Xu, Xl = np.zeros((X.shape), dtype=np.float64), np.zeros((X.shape), dtype=np.float64)
Xu[X >= u] = X[X >= u]
Xl[X <= l] = X[X <= l]
Ac = (np.dot(Xu, Xu.T) + np.dot(Xl, Xl.T) ) / (Xu.shape[1]-1.)
np.fill_diagonal(Ac,0.0)

# plot the adjacency
plt.imshow(Ac);plt.colorbar()
plt.show()

# build laplacian
D = np.diag(np.sum(Ac,axis=1))
L = D - Ac

# eigh
l, v = np.linalg.eigh(L)
i = l.argsort() # sorting
l, v = l[i], v[:,i]

# scree plot of eigenvalues
plt.plot(l[:], 'o-')
plt.show()

# plot first eigenvector -should be constant
plt.plot(v[:,0])
plt.show()

# Sanity check 1: plot fiedler vector -- should be smooth
plt.plot(v[:,1])
plt.show()

# Sanity check 2: it must be $ L  v[:,i] -\lambda v[:,i] = 0 $ for every $i$
ii=1;
plt.plot(np.dot(L, v[:,ii]) - l[ii]*v[:,ii])
plt.show()
The plt.plot(v[:,1]) returns:
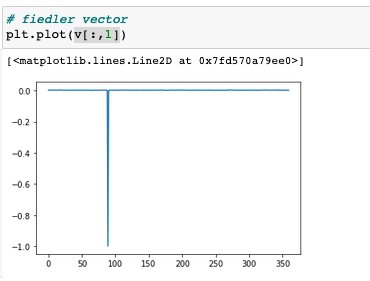
and it is obvious that the spike and this eigenvector is a product of a crashed algorithm.
Why does this happen? How can I solve this?
Issue Analytics
- State:

- Created 3 years ago
- Comments:6 (4 by maintainers)
 Top Results From Across the Web
eigh() tests fail to pass, crash Python with seemingly ramdom ...
In summary, when running the test for eigh() , Python tends to crash with SIGSEGV or SIGABRT. Sometimes this happens during the test_eigh() ......
Read more >Python (numpy) crashes system with large number of array ...
This seems like a case of stack overflow. You have 3,682,800,000 array elements, if I understand your question. What is the element type?...
Read more >scipy.linalg.eigh — SciPy v1.9.3 Manual
Disabling may give a performance gain, but may result in problems (crashes, non-termination) if the inputs do contain infinities or NaNs. turbobool, optional....
Read more >NumPy 1.20.0 Release Notes
This ensures that results cannot depend on the computer or operating system. ... which was thought to be unexpected behavior for a concatenation...
Read more >How to use the NumPy concatenate function - Sharp Sight
The behavior of NumPy concatenate in those cases may have unintended consequences. You can concatenate together many arrays. In the examples I' ...
Read more > Top Related Medium Post
No results found
 Top Related StackOverflow Question
No results found
 Troubleshoot Live Code
Lightrun enables developers to add logs, metrics and snapshots to live code - no restarts or redeploys required.
Start Free Top Related Reddit Thread
No results found
 Top Related Hackernoon Post
No results found
 Top Related Tweet
No results found
 Top Related Dev.to Post
No results found
 Top Related Hashnode Post
No results found
By spikes, I assume you mean the variation in the values in the graph. However, the scale of the graph is very small - around 1e-13. So that effectively means that
np.dot(L, v[:,ii]) - l[ii]*v[:,ii]is 0 (up to floating point precision). In addition, sincev[:, 1]must be a non-zero vector, it makes sense that one of its entries has value -1. Also,np.dot(v.T, v)is effectively the identity matrix which further confirms that this computation is reasonable.Also, we see that the
Ac.mean(axis=0).argmin()is89, the same asv[:, 1].argmin(). That node is indeed uniquely picked out by the adjacency data, so it should not be surprising that it is the lone negative in the Fiedler vector.Given that the eigenvalues and eigenvectors seem to obey the expected properties up to numerical precision, I don’t see any evidence of a problem here.