
Lightrun Answers was designed to reduce the constant googling that comes with debugging 3rd party libraries. It collects links to all the places you might be looking at while hunting down a tough bug.
And, if you’re still stuck at the end, we’re happy to hop on a call to see how we can help out.
Add more visualization features for multi-objective optimization (e.g., constraint handling, animation)
See original GitHub issueMotivation
When I used multi-objective optimization, I wanted new features of plot_pareto_front. I’m not fully sure if they are useful for the other people, but let me share the ideas.
[DONE] 1. Constraint-aware pareto-front plot
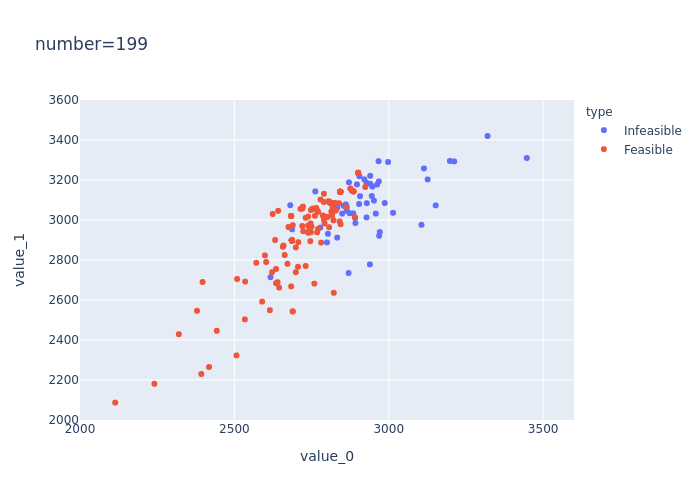
Recently, Optuna enables us to add constraints to multi-objective optimization. The plot_paret_front function, however, does not consider whether the solution is feasible or not. So, I needed to modify it to visualize the constraint optimization.
For example, the following plot is an example of multi-objective knapsack problem. The objectives are to be maximized, but infeasible solutions are likely to be seen in the up-right region. In this case, I couldn’t find the shape of Pareto front without removing the infeasible solutions.
[REJECTED] 2. Animation of evolution
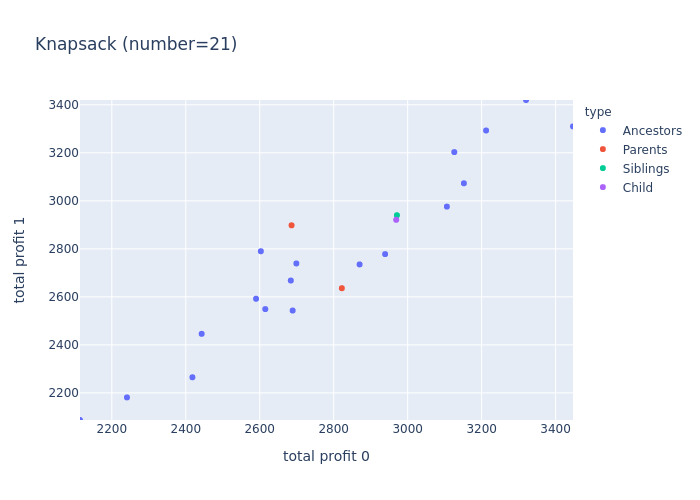
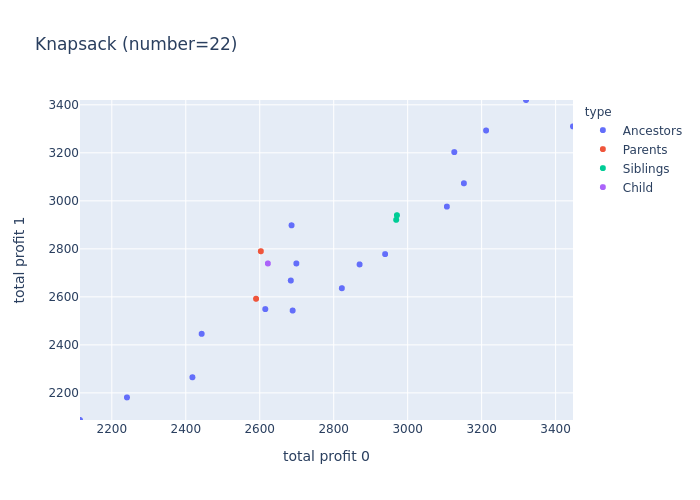
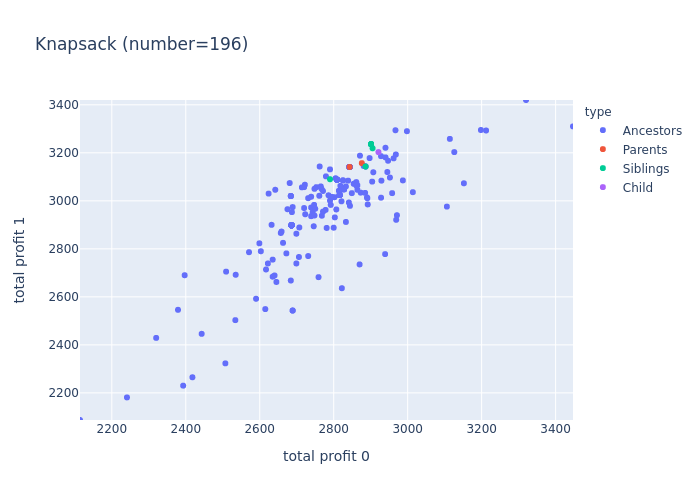
Since the NSGA-II is an evolution-based algorithm, we can traverse parents/ancestors of solutions. When I used the NSGA-II Sampler, I visualized the evolution of solutions using the animation and checked if the genetic operators produced good solutions. I think it is useful if we provide a new visualization feature that shows pareto-front trial by trial including the parents of the newly added point.
The following plots are snapshots of the animation.
 …
…
Description
We may not necessarily implement both features. I think the first one is relatively well-defined.
[DONE] 1. Constraint-aware pareto-front plot
We can add a new argument to plot_pareto_front. I think the design discussion is needed about the way to pass the thresholds and constraint values. Currently, both BoTorchSampler and NSGAIISampler employ the following settings, but we don’t decide it should be kept by upcoming samplers for constraint optimization.
- Threshold is always zero.
- The constraint values are stored in Trial’s system_attr.
[REJECTED] 2. Animation of evolution
I drew the example plots for each trial, but it may be verbose to call the visualization function by the number of trials. So, I think we can use the plotly’s animation functionality to visualize the evolution interactively. We may need to start with some prototypical implementation.
Issue Analytics
- State:

- Created 3 years ago
- Comments:10 (2 by maintainers)
 Top Related StackOverflow Question
 Troubleshoot Live Code
 Top Related Reddit Thread
 Top Related Hackernoon Post
 Top Related Tweet
 Top Related Dev.to Post
 Top Related Hashnode Post
Following 2 features may be useful.
This issue was closed automatically because it had not seen any recent activity. If you want to discuss it, you can reopen it freely.