
Lightrun Answers was designed to reduce the constant googling that comes with debugging 3rd party libraries. It collects links to all the places you might be looking at while hunting down a tough bug.
And, if you’re still stuck at the end, we’re happy to hop on a call to see how we can help out.
Stabilize `plot_pareto_front`
See original GitHub issue(Updated on January 26, 2022)
Motivation
Stable API of multi-objective optimization has been available since Optuna v2.4.0, but the visualization for multi-objective optimization, i.e., optuna.visualization.plot_pareto_front and optuna.visualization.matplotlib.plot_pareto_front, is still experimental.
We have following two issues:
- many-objective optimization support
- constrained-optimization support
This issue mainly describes the first issue since the second issue is tracked in https://github.com/optuna/optuna/issues/3116.
Many-objective optimization support
The current plot_pareto_front is designed for 2 or 3 objective optimization. It does not accept more than 3 objectives. Before stabilizing the plot_pareto_front, I’d like to discuss how to provide support for more than 3 objectives since it may need breaking change in interface.
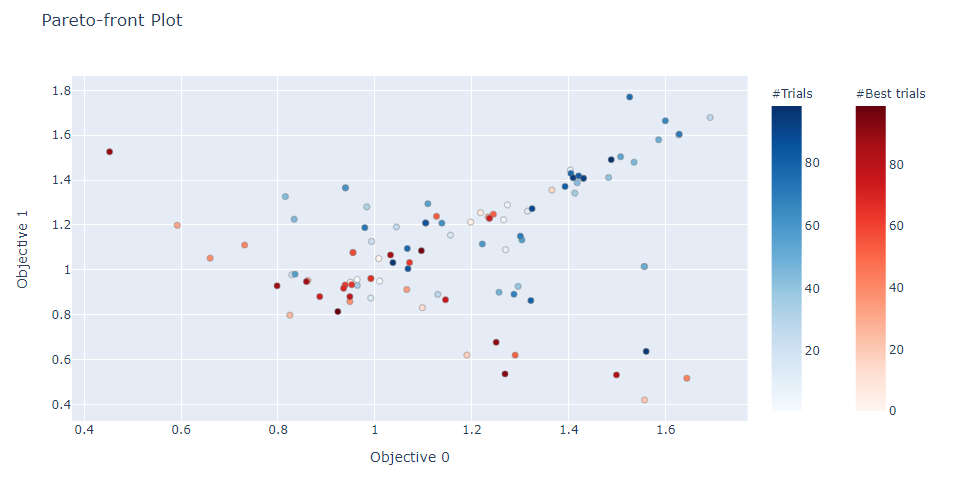
Currently, the function raises errors when studies, and users cannot see trade-off relationship. I guess even a part of trade-off relationship can be useful for users to choose trials. For example, the following plots are the visualization of Pareto-front of the result of four objective optimization (minimization):
Objective 0 vs Objective 1
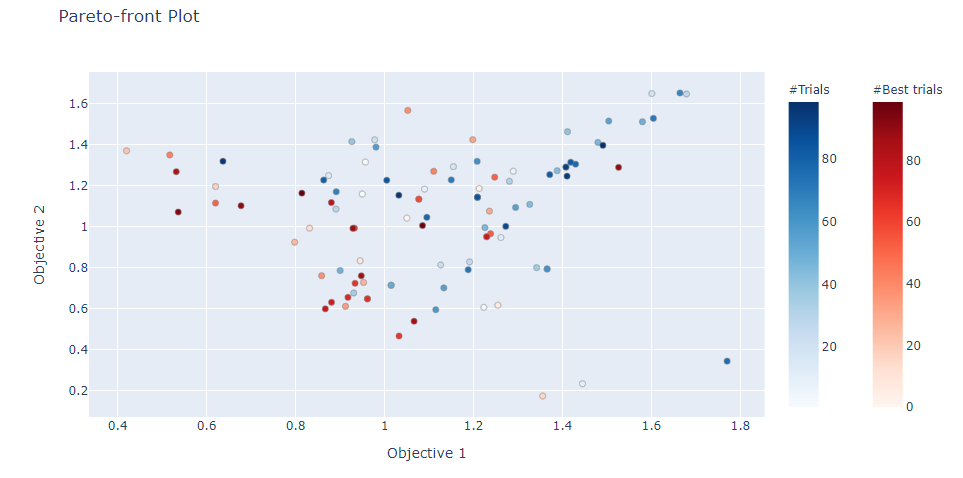
Objective 1 vs Objective 2
Objective 2 vs Objective 3
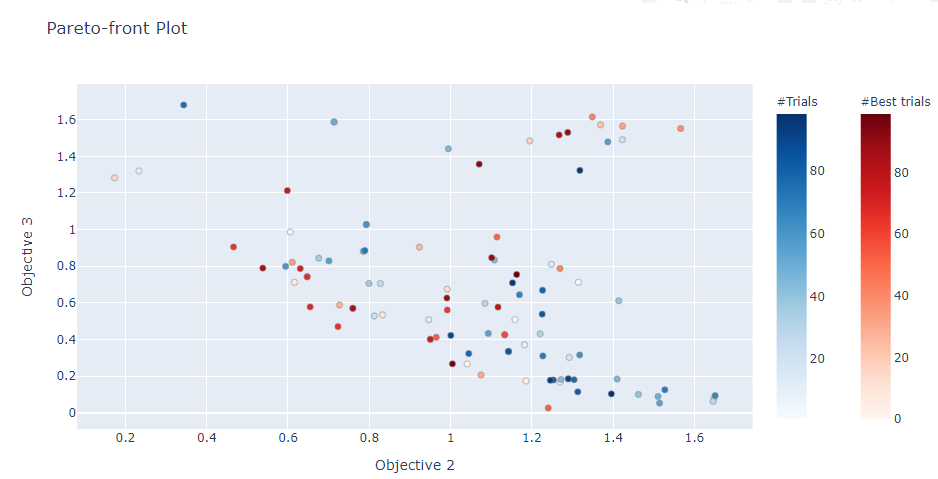
The red dots are the Pareto solutions in four dimensional objective space. Unlike two-objective optimization, we cannot see the whole Pareto front in a single figure, but we can see low-dimensional projection of Pareto front in each plot. It sometimes useful, for instance, when users have priorities in objective values.
Design
Some visualization functions including plot_contour and plot_optimization_history have the target argument to select the values to display. We can follow the convention to choose the objective values. plot_pareto_front expects two or three values, so the argument name should be targets. The signature and the example input are as follows:
# Signature
targets: Optional[Callable[[FrozenTrial], Sequence[float]]]

# Example 1. Objective 0 vs Objective 1
targets=lambda t: (t.values[0], t.values[1])

# Example 2. Objective 2 vs Objective 1 vs Objective 0
targets=lambda t: (t.values[2], t.values[1], t.values[0])

# Example 3. This is not a conventional Pareto-front, but we can visualize the relationship between parameter and objectives
targets=lambda t: (t.params["x"], t.values[0], t.values[1])
As can be seen in the example 2, targets covers the functionality of axis_order, and we can remove the axis_order in a future. To keep backward compatibility, we can keep the axis_order, but targets and axis_order are not supposed to be used at once for simplicity.
Tasks
The task are as follows:
- Add
targetsargument - Deprecate
axis_orderargument - Update
optuna.visualization.plot_pareto_frontaccording tooptuna.visualization.matplotlib.plot_pareto_front - ~Feedback from early-bird users~
- Remove
experimentaldecorator
(Note that we’d like to stabilize optuna.visualization.plot_pareto_front first, then optuna.visualization.matplotlib.plot_pareto_front will follow it.)
Alternative (Not V3 task)
As shown in some research papers, parallel coordinates plot seems to be widely used to visualize many objective optimization results. I think we can extend plot_parallel_coordinate or create a new plot function for such visualization.
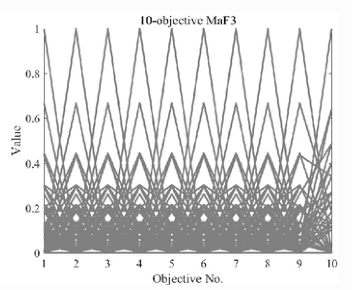 (excerpted from A benchmark test suite for evolutionary many-objective optimization)
Related issues
- Currently, all matplotlib-based visualization functions are experimental. See https://github.com/optuna/optuna/issues/2959.
- Possible extension of
plot_pateto_frontcan be fond in https://github.com/optuna/optuna/issues/2397.
Issue Analytics
- State:

- Created 2 years ago
- Comments:8 (8 by maintainers)
 Top Related StackOverflow Question
 Troubleshoot Live Code
 Top Related Reddit Thread
 Top Related Hackernoon Post
 Top Related Tweet
 Top Related Dev.to Post
 Top Related Hashnode Post
📝 Verified on Google Colab that there were no issues. Both the Plotly and the matplotlib backends, with both 2 and 3 objectives rendered as expected.
I’m implementing the feature of this issue with matplotlib.