
Stuck on an issue?
Lightrun Answers was designed to reduce the constant googling that comes with debugging 3rd party libraries. It collects links to all the places you might be looking at while hunting down a tough bug.
And, if you’re still stuck at the end, we’re happy to hop on a call to see how we can help out.
Bar Plot Limited Resolution Results in Wrong Bars
See original GitHub issueI have the following values and keys for a horzizontal bar chart (value,key):
[(-0.6151373541529737, 42), (0.49192003213366264, 49), (0.42558999886357973, 89), (-0.4157197042616422, 52), (-0.4146001680909118, 37)]
My code is like this:
plt.clf()
plt.bar(keys, values, orientation = "horizontal", width = 1) # or shorter orientation = 'h'
plt.title('Strongest indexes in hidden layer (The following charts come in the same order)')
plt.plotsize(100, n + 4) # 4 = (1 for x numerical ticks + 2 for x axes + 1 for title)
plt.show()
The output is the following:
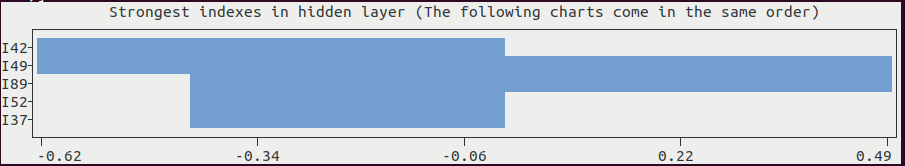
You see I49 and I89 are not displayed correctly. They start in the negative area, which is not correct.
Issue Analytics
- State:

- Created a year ago
- Reactions:1
- Comments:11 (6 by maintainers)
 Top Results From Across the Web
Rule 17: Not too many bars - AddTwo
Too many bars is always bad; that's what too many means. ... Or at least it will have morphed from a bar chart...
Read more >Error bars stacked in a wrong position on a bar plot
Your error bars are in the "wrong" place, because you're stacking your bars. If you change the position argument from stack to dodge ......
Read more >Bar Chart Visualization - Qualtrics
An bar chart only displays two bars because one has been deselected under Axis Values. You can also click and drag values to...
Read more >Estimating Bar Graph Averages: Overcoming Within-the-Bar ...
This study proposes and tests two methods based on information processing to reduce within-the-bar bias. The first method facilitates bottom-up ...
Read more >A Complete Guide to Bar Charts | Tutorial by Chartio
Bar charts are a fundamental visualization for comparing values between groups of data. Use this guide to learn how to get the most...
Read more > Top Related Medium Post
No results found
 Top Related StackOverflow Question
No results found
 Troubleshoot Live Code
Lightrun enables developers to add logs, metrics and snapshots to live code - no restarts or redeploys required.
Start Free Top Related Reddit Thread
No results found
 Top Related Hackernoon Post
No results found
 Top Related Tweet
No results found
 Top Related Dev.to Post
No results found
 Top Related Hashnode Post
No results found
Hi @piccolomo, no, I don’t need the fix at the moment. I just wanted to test it.
Besides, I find that plotext is really a great tool! For console applications, really really practical! Thanks a lot for doing this work.
appreciated ! 🙂