
Lightrun Answers was designed to reduce the constant googling that comes with debugging 3rd party libraries. It collects links to all the places you might be looking at while hunting down a tough bug.
And, if you’re still stuck at the end, we’re happy to hop on a call to see how we can help out.
Idea: Allow plotly.js to accept numpy buffers
See original GitHub issueIf we allowed all GL plot types to accept numpy buffers for plot x/y/z data, then the Python library could optionally avoid JSON serialization of array data, like @maartenbreddels does in his brillant project ipyvolume:
https://github.com/maartenbreddels/ipyvolume/blob/master/ipyvolume/serialize.py#L95
Here is the deserialization on the JS side:
https://github.com/maartenbreddels/ipyvolume/blob/master/js/src/serialize.js#L16
Plotly.js has all of these incredible WebGL figures for scientific computing, but their potential in Python, R, MATLAB, etc is limited by the JSON serialization step.
In a similar vein, it seems like all GL types should be able to accept Float32Array’s directly instead of untyped JS arrays. Currently, it looks like only the Plotly trace type pointcloud accepts Float32Array’s:
Issue Analytics
- State:

- Created 6 years ago
- Reactions:2
- Comments:13 (11 by maintainers)
 Top Related StackOverflow Question
 Troubleshoot Live Code
 Top Related Reddit Thread
 Top Related Hackernoon Post
 Top Related Tweet
 Top Related Dev.to Post
 Top Related Hashnode Post
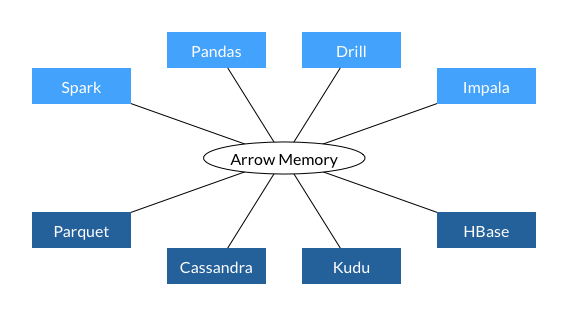
Somewhat related to this thread and the topic of data serialization: I came across Apache Arrow which is a cross-language in-memory representation for columnar data to go from the current inefficient copy & convert: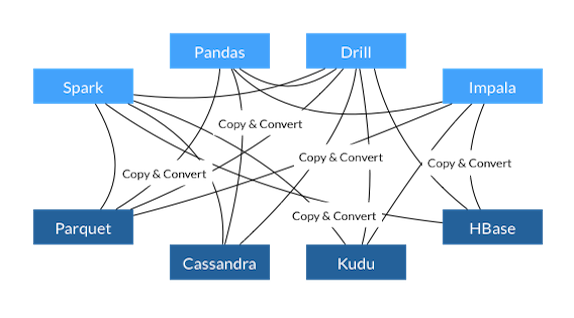 to a much-more efficient:
This issue has been tagged with
NEEDS SPON$ORA community PR for this feature would certainly be welcome, but our experience is deeper features like this are difficult to complete without the Plotly maintainers leading the effort.
Sponsorship range: $10k-$15k
What Sponsorship includes:
Please include the link to this issue when contacting us to discuss.