
Lightrun Answers was designed to reduce the constant googling that comes with debugging 3rd party libraries. It collects links to all the places you might be looking at while hunting down a tough bug.
And, if you’re still stuck at the end, we’re happy to hop on a call to see how we can help out.
Understanding Spherical Projection
See original GitHub issueHello,
I’ve been trying to understand the spherical projection process. I generated the projection mask for a few scans from sequence 00, scans 0-2:


I used the following projection parameters:
proj_H = 64, proj_W = 2048, proj_fov_up = 3.0, proj_fov_down = -25.0
I can’t find an explanation for the empty rows that appear in the image. I also see them in the example image in the readme file of the repo. But when I follow the similar projection procedure (with changing the projection parameters of course) for other lidars, like Ouster 128, I don’t see this effect:
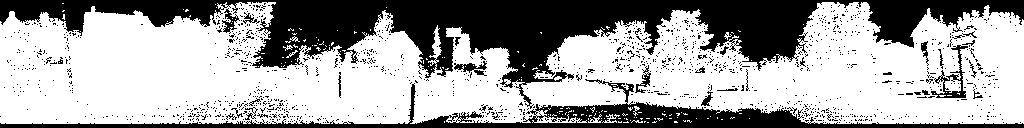
What’s the reason behind those empty lines in the projected image of Velodyne 64? Is there a better way to do the projection and get rid of them?
Thank you in advance.
Issue Analytics
- State:

- Created 2 years ago
- Reactions:1
- Comments:6 (3 by maintainers)
 Top Related StackOverflow Question
 Troubleshoot Live Code
 Top Related Reddit Thread
 Top Related Hackernoon Post
 Top Related Tweet
 Top Related Dev.to Post
 Top Related Hashnode Post
Regarding the first thing:
KITTI provides only point clouds and in case of the odometry part of the data, these point clouds are modified by adding the motion of the vehicle. The rotation of the LiDAR takes some time and therefore beams are in reality not fired all at the same spatial location if the vehicle moves. This motion is accounted for and the points are transformed accordingly. That’s why you can see a spiral-like pattern of the LiDAR point cloud when you see it from above.
And that’s right. A rotating LiDAR produces exactly the right format and you can use it like this.
Again, the projection is only needed when we only have a point cloud, like in the case of KITTI odometry dataset.
Thank you. I understand better now.