
Lightrun Answers was designed to reduce the constant googling that comes with debugging 3rd party libraries. It collects links to all the places you might be looking at while hunting down a tough bug.
And, if you’re still stuck at the end, we’re happy to hop on a call to see how we can help out.
Memory leak
See original GitHub issueHi Prisma Team! My Prisma Client just crashed.
I currently have issues with Prisma that is deployed on Google App Engine. There is clearly a memory leak and I get a lot of errors from prisma - Error in PostgreSQL connection: Error { kind: Closed, cause: None }. I am using a single prisma client to access everything and couldn’t find any issues, so any help would be appreciated.
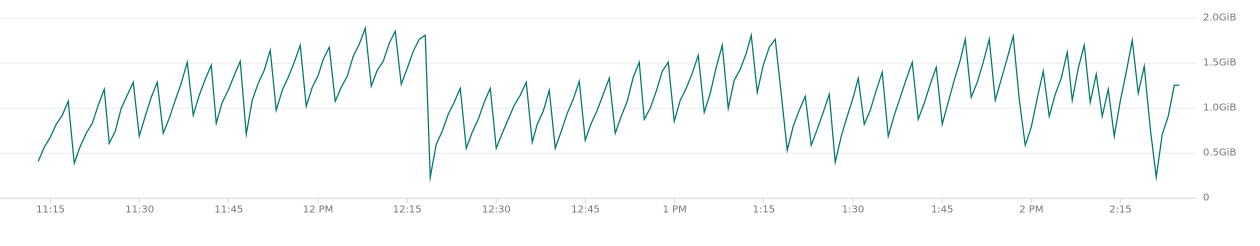
The memory usage starts at 400MB (normal) goes all the way to 1.5GB at which point the instance resets since the memory exceeded the threshold. Memory usage picture below. I already got more than 2.5k My Prisma Client just crashed errors like below in less than 24h (most of them at the time of the restart) out of cca 100k read/writes.
Before implementing prisma, the memory usage was around 500MB.
Let me also note that I catching a lot of expected prisma errors (50k+ in 24h) like:
- NotFoundError: No User found Error: NotFoundError: No User found
- Invalid
prisma.user.update()invocation: An operation failed because it depends on one or more records that were required but not found. Record to update not found. - Invalid
prisma.lessonActivity.create()invocation: Foreign key constraint failed on the field:LessonActivity_userId_fkey (index)
Since this was just deployed to write new data, while old will be migrated if everything is fine. Are maybe the errors the problem? But since they are getting handled, it shouldn’t be an issue.
The report is below:
Versions
| Name | Version |
|---|---|
| Node | v12.21.0 |
| OS | debian-openssl-1.1.x |
| Prisma Client | 2.19.0 |
| Query Engine | query-engine c1455d0b443d66b0d9db9bcb1bb9ee0d5bbc511d |
| Database | unknown |
Query
query {
  findUniqueUser(where: {
    id: "X"
  }) {
    progress
  }
}
There are a lot of different queries in the errors (I just copied one), so I don’t think this matters that much
Logs
Fetched a connection from the pool
prisma:engine stdout  Unknown error
prisma:engine {
  error: PrismaClientUnknownRequestError2 [PrismaClientUnknownRequestError]: Error in connector: Error querying the database: connection closed
      at NodeEngine.graphQLToJSError (/workspace/node_modules/@prisma/client/runtime/index.js:29799:14)
      at NodeEngine.request (/workspace/node_modules/@prisma/client/runtime/index.js:29695:24)
      at runMicrotasks (<anonymous>)
      at processTicksAndRejections (internal/process/task_queues.js:97:5)
      at async cb (/workspace/node_modules/@prisma/client/runtime/index.js:34744:26) {
    clientVersion: '2.19.0'
  }
}
prisma:engine stdout  Fetched a connection from the pool
prisma:engine stdout  Unknown error
prisma:engine {
  error: PrismaClientUnknownRequestError2 [PrismaClientUnknownRequestError]: Error occurred during query execution:
  ConnectorError(ConnectorError { user_facing_error: None, kind: QueryError(Error { kind: Closed, cause: None }) })
      at NodeEngine.graphQLToJSError (/workspace/node_modules/@prisma/client/runtime/index.js:29799:14)
      at NodeEngine.request (/workspace/node_modules/@prisma/client/runtime/index.js:29695:24)
      at runMicrotasks (<anonymous>)
      at processTicksAndRejections (internal/process/task_queues.js:97:5) {
    clientVersion: '2.19.0'
  }
}
prisma:engine stdout  Fetched a connection from the pool
prisma:engine stdout  Unknown error
prisma:engine {
  error: PrismaClientUnknownRequestError2 [PrismaClientUnknownRequestError]: Error in connector: Error querying the database: connection closed
      at NodeEngine.graphQLToJSError (/workspace/node_modules/@prisma/client/runtime/index.js:29799:14)
      at NodeEngine.request (/workspace/node_modules/@prisma/client/runtime/index.js:29695:24)
      at runMicrotasks (<anonymous>)
      at processTicksAndRejections (internal/process/task_queues.js:97:5)
      at async cb (/workspace/node_modules/@prisma/client/runtime/index.js:34744:26) {
    clientVersion: '2.19.0'
  }
}
Error in PostgreSQL connection: Error { kind: Closed, cause: None }&template=bug_report.md
Issue Analytics
- State:

- Created 2 years ago
- Comments:11 (4 by maintainers)
 Top Related StackOverflow Question
 Troubleshoot Live Code
 Top Related Reddit Thread
 Top Related Hackernoon Post
 Top Related Tweet
 Top Related Dev.to Post
 Top Related Hashnode Post
@janpio I did some testing and it’s not just a Google App Engine issue, I could easily reproduce it locally on my machine.
I was sending a batches of 1k requests to my API and after I got response from all I repeated this 10x for total of 10k requests. Then I waited for all the requests to finish processing (cca 5min) and I ran the complete flow 3 more times without restarting the instance.
This is the result of the first test where Prisma is reading and writing alongside Firebase:
We can clearly see that the RAM keeps getting bigger and bigger even when there are no new requests being sent.
I ran the same flow again without the prisma code out and this is the result:
This is the prisma code:
For other people coming from google searches on “jest prisma memory leak”, then there is a ongoing a memory issue in #12370