
Stuck on an issue?
Lightrun Answers was designed to reduce the constant googling that comes with debugging 3rd party libraries. It collects links to all the places you might be looking at while hunting down a tough bug.
And, if you’re still stuck at the end, we’re happy to hop on a call to see how we can help out.
Metrics are not shown in Prometheus query browser.
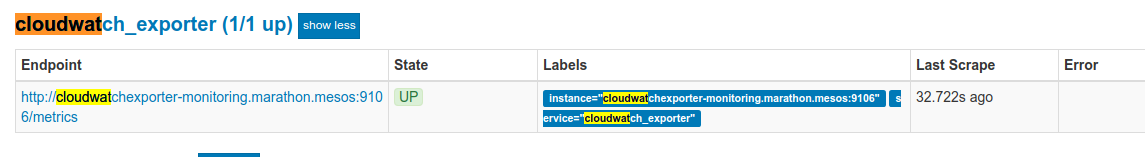
See original GitHub issueI am not able to see metrics exposed by cloudwatch_exporter except below three metrics. However if i curl to cloudwatch_exporter endpoint it shows all metrics.

Can you tell me why i cant see. My configuration is
---
region: eu-central-1
metrics:
# S3 Storage metrics are published to Cloudwatch 1x per day with a timestamp of midnight UTC, hence period_seconds: 86400
# Publishing does not always occur at the same time, but it will occur before the next day, hence range_seconds: 172800
- aws_namespace: AWS/S3
  aws_metric_name: BucketSizeBytes
  aws_dimensions: [BucketName, StorageType]
  aws_statistics: [Average] # Valid statistics (https://docs.aws.amazon.com/AmazonS3/latest/dev/cloudwatch-monitoring.html): Average
  range_seconds: 172800
  period_seconds: 86400

- aws_namespace: AWS/S3
  aws_metric_name: NumberOfObjects
  aws_dimensions: [BucketName, StorageType]
  aws_statistics: [Average] # Valid statistics (https://docs.aws.amazon.com/AmazonS3/latest/dev/cloudwatch-monitoring.html): Average
  range_seconds: 172800
  period_seconds: 86400
Prometheus Configuration:
  # Scrape AWS service
  - job_name: cloudwatch_exporter
    scrape_interval: 60s
    scrape_timeout:  30s
    metrics_path: "/metrics"
    static_configs:
    - targets: ['cloudwatchexporter-monitoring.marathon.mesos:9106']
      labels:
        service: cloudwatch_exporter
Issue Analytics
- State:

- Created 5 years ago
- Reactions:3
- Comments:11 (1 by maintainers)
 Top Results From Across the Web
AWS cloudwatch metrics are not shown in Prometheus query ...
Not able to see any metrics in the Prometheus query browser while cloudwatch_exporter endpoint shows all metrics.
Read more >Querying basics - Prometheus.io
The result of an expression can either be shown as a graph, viewed as tabular data ... The metric name must not be...
Read more >1817852 – prometheus is not showing metrics
I am elaborating the issue: - All pods from openshift-monitoring were up and running. When we try to execute queries on prometheus console ......
Read more >Grey message "no metrics found" in grafana query field
I can not see any metrics in promQL field, I am using process-exporter, data source is prometheus. It is running and working.
Read more >View and query your Prometheus data
All metrics for Docker and Kubernetes are stored in the Metric type. Default attributes for the OpenMetrics integration. By default, the following attributes ......
Read more > Top Related Medium Post
No results found
 Top Related StackOverflow Question
No results found
 Troubleshoot Live Code
Lightrun enables developers to add logs, metrics and snapshots to live code - no restarts or redeploys required.
Start Free Top Related Reddit Thread
No results found
 Top Related Hackernoon Post
No results found
 Top Related Tweet
No results found
 Top Related Dev.to Post
No results found
 Top Related Hashnode Post
No results found
Please set “set_timestamp: false” in cloudwatch_exporter.yml and restart it to resolve this issue.
If you are using kube helm for cloudwatch exporter.Create a values.yml file and add your changes like below. config: |- region: ap-southeast-1 period_seconds: 240 set_timestamp: false #Added set_timestamp false metrics:
And upgrade the helm helm upgrade --namespace monitoring -f values.yml cloudwatch-exporter-prometheus stable/prometheus-cloudwatch-exporter