
Lightrun Answers was designed to reduce the constant googling that comes with debugging 3rd party libraries. It collects links to all the places you might be looking at while hunting down a tough bug.
And, if you’re still stuck at the end, we’re happy to hop on a call to see how we can help out.
JMX Exporter can not collect Apache Ignite (v2.8.0) metrics
See original GitHub issueHello,
the jmx_exporter can not collect most part of metrics after Apache Ignite 2.8.0 release. It worked with 2.7.0 but it doesn’t now. Hope you can help me. So let me describe my problem:
First of all I’m using docker to run Apache Ignite, expose all ports on host system and add jmx_prometheus_javaagent:
docker run -it --net=host -e "CONFIG_URI=https://raw.githubusercontent.com/bostonaqua/bostonaqua/master/example-ignite.xml" -e "JAVA_TOOL_OPTIONS=-javaagent:/prometheus/jmx_prometheus_javaagent-0.12.0.jar=9091:/prometheus/ignite-config.yaml" -v $(pwd)/ignite-config.yaml:/prometheus/ignite-config.yaml -v $(pwd)/jmx_prometheus_javaagent-0.12.0.jar:/prometheus/jmx_prometheus_javaagent-0.12.0.jar apacheignite/ignite:2.8.0
https://raw.githubusercontent.com/bostonaqua/bostonaqua/master/example-ignite.xml - here I enable the ignite metric exporter as described in docs: https://apacheignite.readme.io/docs/new-metrics
My prometheus/ignite-config.yaml:
hostPort: 127.0.0.1:49112
lowercaseOutputLabelNames: true
lowercaseOutputName: true
rules:
  - pattern: "^org.apache<clsLdr=(.+), group=cache,*"
Then I go to http://localhost:9091/ and get only jvm metrics. Ok, lets look at logs:
[20:40:33,218][SEVERE][pool-1-thread-1][JmxCollector] JMX scrape failed: java.lang.ClassCastException: javax.management.openmbean.TabularDataSupport cannot be cast to javax.management.Attribute
	at io.prometheus.jmx.shaded.io.prometheus.jmx.JmxScraper.scrapeBean(JmxScraper.java:156)
	at io.prometheus.jmx.shaded.io.prometheus.jmx.JmxScraper.doScrape(JmxScraper.java:117)
	at io.prometheus.jmx.shaded.io.prometheus.jmx.JmxCollector.collect(JmxCollector.java:468)
	at io.prometheus.jmx.shaded.io.prometheus.client.CollectorRegistry$MetricFamilySamplesEnumeration.findNextElement(CollectorRegistry.java:183)
	at io.prometheus.jmx.shaded.io.prometheus.client.CollectorRegistry$MetricFamilySamplesEnumeration.nextElement(CollectorRegistry.java:216)
	at io.prometheus.jmx.shaded.io.prometheus.client.CollectorRegistry$MetricFamilySamplesEnumeration.nextElement(CollectorRegistry.java:137)
	at io.prometheus.jmx.shaded.io.prometheus.client.exporter.common.TextFormat.write004(TextFormat.java:22)
	at io.prometheus.jmx.shaded.io.prometheus.client.exporter.HTTPServer$HTTPMetricHandler.handle(HTTPServer.java:59)
	at com.sun.net.httpserver.Filter$Chain.doFilter(Filter.java:79)
	at sun.net.httpserver.AuthFilter.doFilter(AuthFilter.java:83)
	at com.sun.net.httpserver.Filter$Chain.doFilter(Filter.java:82)
	at sun.net.httpserver.ServerImpl$Exchange$LinkHandler.handle(ServerImpl.java:675)
	at com.sun.net.httpserver.Filter$Chain.doFilter(Filter.java:79)
	at sun.net.httpserver.ServerImpl$Exchange.run(ServerImpl.java:647)
	at java.util.concurrent.ThreadPoolExecutor.runWorker(ThreadPoolExecutor.java:1149)
	at java.util.concurrent.ThreadPoolExecutor$Worker.run(ThreadPoolExecutor.java:624)
	at java.lang.Thread.run(Thread.java:748)

[20:40:33,416][SEVERE][pool-1-thread-2][JmxCollector] JMX scrape failed: java.lang.ClassCastException: javax.management.openmbean.TabularDataSupport cannot be cast to javax.management.Attribute
	at io.prometheus.jmx.shaded.io.prometheus.jmx.JmxScraper.scrapeBean(JmxScraper.java:156)
	at io.prometheus.jmx.shaded.io.prometheus.jmx.JmxScraper.doScrape(JmxScraper.java:117)
	at io.prometheus.jmx.shaded.io.prometheus.jmx.JmxCollector.collect(JmxCollector.java:468)
	at io.prometheus.jmx.shaded.io.prometheus.client.CollectorRegistry$MetricFamilySamplesEnumeration.findNextElement(CollectorRegistry.java:183)
	at io.prometheus.jmx.shaded.io.prometheus.client.CollectorRegistry$MetricFamilySamplesEnumeration.nextElement(CollectorRegistry.java:216)
	at io.prometheus.jmx.shaded.io.prometheus.client.CollectorRegistry$MetricFamilySamplesEnumeration.nextElement(CollectorRegistry.java:137)
	at io.prometheus.jmx.shaded.io.prometheus.client.exporter.common.TextFormat.write004(TextFormat.java:22)
	at io.prometheus.jmx.shaded.io.prometheus.client.exporter.HTTPServer$HTTPMetricHandler.handle(HTTPServer.java:59)
	at com.sun.net.httpserver.Filter$Chain.doFilter(Filter.java:79)
	at sun.net.httpserver.AuthFilter.doFilter(AuthFilter.java:83)
	at com.sun.net.httpserver.Filter$Chain.doFilter(Filter.java:82)
	at sun.net.httpserver.ServerImpl$Exchange$LinkHandler.handle(ServerImpl.java:675)
	at com.sun.net.httpserver.Filter$Chain.doFilter(Filter.java:79)
	at sun.net.httpserver.ServerImpl$Exchange.run(ServerImpl.java:647)
	at java.util.concurrent.ThreadPoolExecutor.runWorker(ThreadPoolExecutor.java:1149)
	at java.util.concurrent.ThreadPoolExecutor$Worker.run(ThreadPoolExecutor.java:624)
	at java.lang.Thread.run(Thread.java:748)
Then I ran jmx_prometheus_httpserver-0.12.0-jar-with-dependencies.jar to get more info with logging level=all:
...
Apr 04, 2020 11:36:45 PM io.prometheus.jmx.JmxScraper logScrape
FINE: scrape: 'org.apache:clsLdr=18b4aac2,group="Thread Pools",name=GridIgfsExecutor'_'RejectedExecutionHandlerClass': process
Apr 04, 2020 11:36:45 PM io.prometheus.jmx.JmxScraper logScrape
FINE: scrape: 'org.apache{clsLdr=18b4aac2, group="Thread Pools", name=GridIgfsExecutor}RejectedExecutionHandlerClass': java.util.concurrent.ThreadPoolExecutor$AbortPolicy
Apr 04, 2020 11:36:45 PM io.prometheus.jmx.JmxScraper doScrape
FINE: TIME: 38508589 ns for org.apache:clsLdr=18b4aac2,group="Thread Pools",name=GridIgfsExecutor
Apr 04, 2020 11:36:45 PM io.prometheus.jmx.JmxCollector collect
SEVERE: JMX scrape failed: java.lang.ClassCastException: javax.management.openmbean.TabularDataSupport cannot be cast to javax.management.Attribute
	at io.prometheus.jmx.JmxScraper.scrapeBean(JmxScraper.java:156)
	at io.prometheus.jmx.JmxScraper.doScrape(JmxScraper.java:117)
	at io.prometheus.jmx.JmxCollector.collect(JmxCollector.java:468)
	at io.prometheus.client.CollectorRegistry$MetricFamilySamplesEnumeration.findNextElement(CollectorRegistry.java:183)
...
The same, but some objects are scraped.
Maybe bad data? But I got these metrics from jconsole:
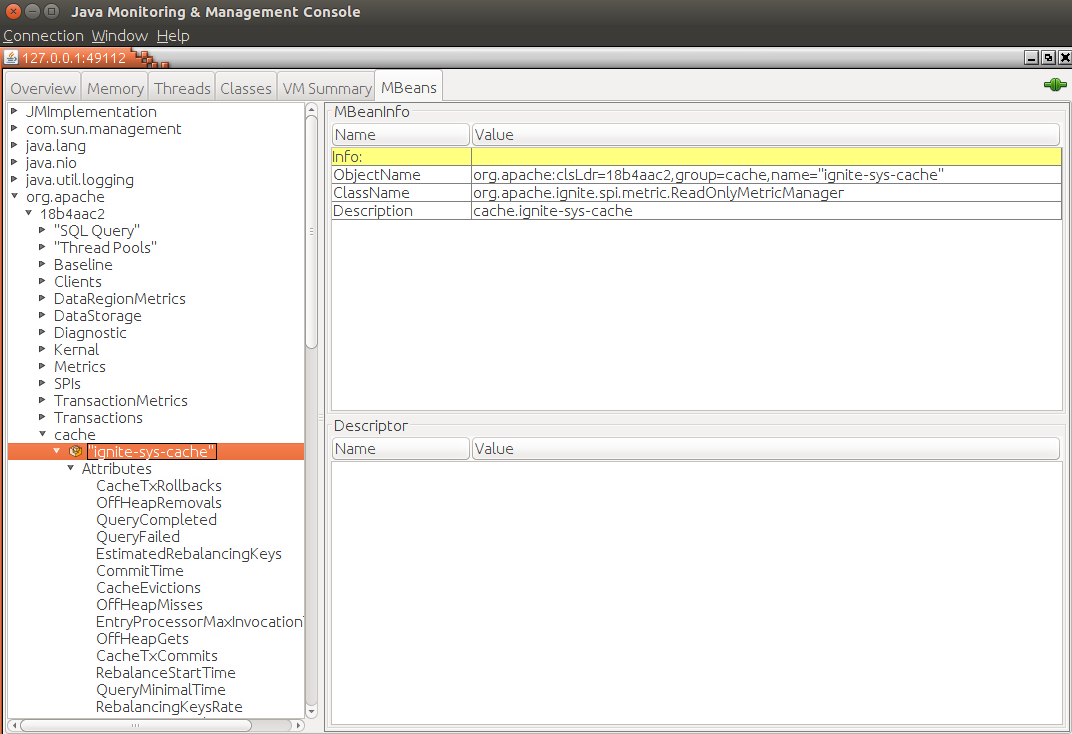

I’m not a java developer and would be great if you can help me. Thanks.
Issue Analytics
- State:

- Created 3 years ago
- Comments:6 (2 by maintainers)
 Top Related StackOverflow Question
 Troubleshoot Live Code
 Top Related Reddit Thread
 Top Related Hackernoon Post
 Top Related Tweet
 Top Related Dev.to Post
 Top Related Hashnode Post
Well - where to start. This kind of attitude made me actually log in and comment on this. Firstly - this could be an issue with the framework used by the application that’s being monitored, not within the application (as it is in my case - the “bug” is in Wildfly 10). Secondly - playing “blame game”, instead of just trying to improve the solution isn’t going to take you anywhere. Bug or feature - regardless - this should be improved. [EDITED: Thankfully, it turns out that there’s a property called
blacklistObjectNames. Yay! Should work as a workaround!]I’d vote for simply catching such exceptions and ignoring invalid data. I’m sincerely surprised this never crossed your mind. As result, we might be forced to fork the code just to catch such exception, as it’s not possible for me to fix it in third party code…
I’ve followed up on this thread because it’s at the top of Google results and seems to be the most relevant. Let me know if you’d like to open a new issue for this.
I’ve currently resolved my problem by disabling all Ignite exported metrics: