
Lightrun Answers was designed to reduce the constant googling that comes with debugging 3rd party libraries. It collects links to all the places you might be looking at while hunting down a tough bug.
And, if you’re still stuck at the end, we’re happy to hop on a call to see how we can help out.
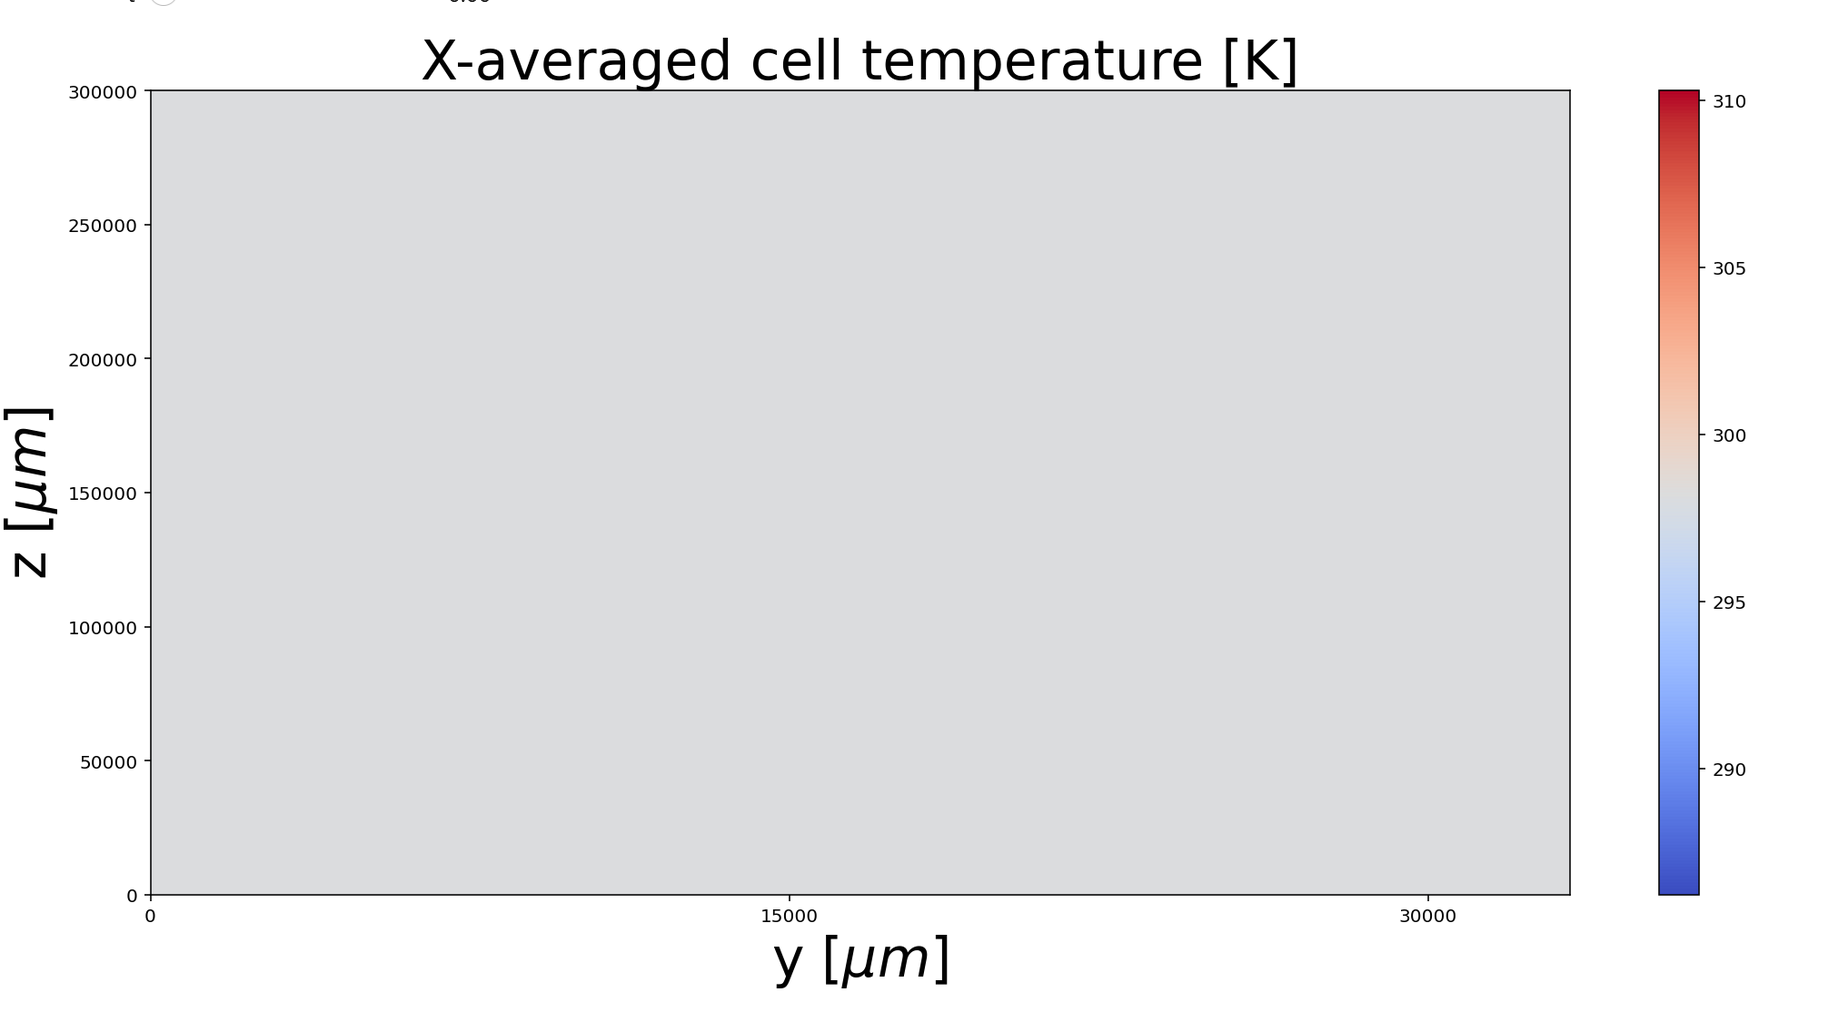
Incorrect values for y axis in 2D simulation?
See original GitHub issueDescribe the bug
This might not be a bug but just me not understanding how to do things properly (PyBaMM beginner…).
When using a 2+1D pouch cell model, the plot uses values for the y (horizontal) axis which are not what I would expect based on the Electrode width parameter setting.
To Reproduce Steps to reproduce the behaviour:
import pybamm

options = {"cell geometry": "pouch", "thermal": "x-lumped", "dimensionality": 2}
model = pybamm.lithium_ion.SPM(options=options)
geometry = model.default_geometry

parameter_values = model.default_parameter_values
parameter_values.update(
    {
        "Electrode height [m]": 0.3,
        "Electrode width [m]": 0.1,
        "Negative tab width [m]": 0.03,
        "Positive tab width [m]": 0.03,
        "Negative tab centre y-coordinate [m]": 0.03,
        "Positive tab centre y-coordinate [m]": 0.07,
        "Negative tab centre z-coordinate [m]": 0.3,
        "Positive tab centre z-coordinate [m]": 0.3,
    }
)
parameter_values.process_model(model)
parameter_values.process_geometry(geometry)

sim = pybamm.Simulation(model, parameter_values=parameter_values, solver=pybamm.CasadiSolver("fast"))
sim.solve([0, 60])
Expected behaviour
I expected the horizontal axis (y) to extend from 0 to 10 cm.
Screenshots
Additional context
Using PyBaMM 0.3.0 or current master (no difference). Python 3.8.5.
Issue Analytics
- State:

- Created 3 years ago
- Comments:7 (3 by maintainers)
 Top Related StackOverflow Question
 Troubleshoot Live Code
 Top Related Reddit Thread
 Top Related Hackernoon Post
 Top Related Tweet
 Top Related Dev.to Post
 Top Related Hashnode Post
FYI, you can pass the plot function a “spatial_unit” argument to display mm or m instead of um https://pybamm.readthedocs.io/en/latest/source/plotting/quick_plot.html
Thanks for the quick fix!