
Stuck on an issue?
Lightrun Answers was designed to reduce the constant googling that comes with debugging 3rd party libraries. It collects links to all the places you might be looking at while hunting down a tough bug.
And, if you’re still stuck at the end, we’re happy to hop on a call to see how we can help out.
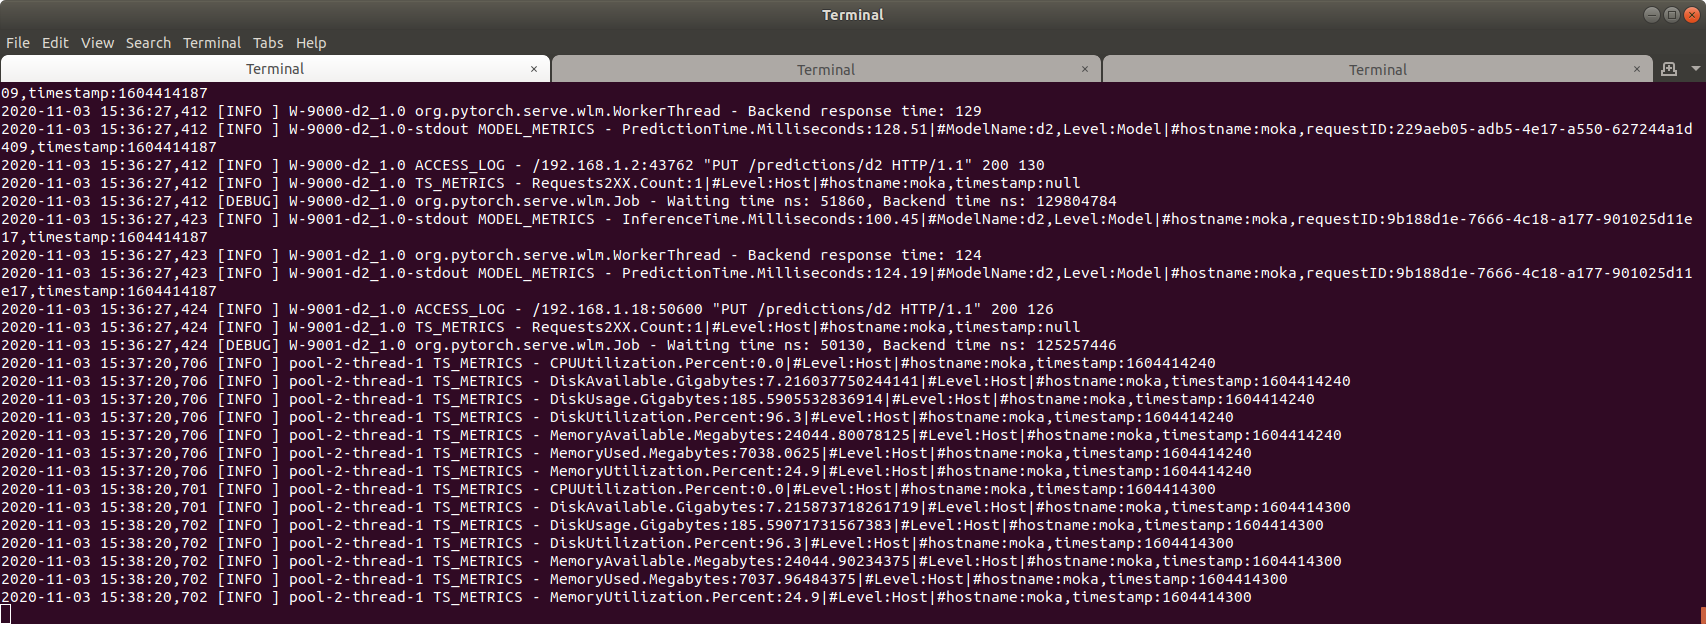
DiskAvailable: Possible memory leak?
See original GitHub issueHi, I’m new to TorchServe, started only yesterday, but since then I’ve noticed that it’s consuming space on my hard disk quite rapidly. Please see two screenshots attached, two hours apart, and I wasn’t even running TS all the time.
Context
- torchserve version: 0.2.0
- torch version: 1.6.0
- torchvision version [if any]: 0.7.0
- torchtext version [if any]: –
- torchaudio version [if any]: –
- java version: openjdk-11-jdk
- Operating System and version: Ubuntu 18.04.5 LTS
Your Environment
- Installed using source? [yes/no]: No
- Are you planning to deploy it using docker container? [yes/no]: Maybe
- Is it a CPU or GPU environment?: 2 GPUs
- Using a default/custom handler? [If possible upload/share custom handler/model]: custom handler (see below)
- What kind of model is it e.g. vision, text, audio?: detectron2 object detection model
- Are you planning to use local models from model-store or public url being used e.g. from S3 bucket etc.?: local model
- Provide config.properties, logs [ts.log] and parameters used for model registration/update APIs:
- Link to your project [if any]: –

Custom Handler
class d2Handler(object):
    """TorchServe Handler for detectron2."""

    def __init__(self):
        """Construct a d2Handler."""
        self.logger = logging.getLogger(__name__)

        self.device = 'cpu'
        self.initialized = False

    def initialize(self, context):
        """Initialize model.

        Args:
            context: TorchServe context.
        """
        self.context = context
        if CUDA:
            self.device = "cuda:" + \
                str(self.context.system_properties.get('gpu_id'))
        self.cfg = setup_cfg('test', self.device)
        self.predictor = BatchPredictor(self.cfg)
        self.initialized = True
        self.logger.info("Model initialized.")

    def preprocess(self, requests):
        """Transform http requests into images."""
        images = []
        for request in requests:
            image = request.get('body')
            image = io.BytesIO(image)
            image = np.frombuffer(image.read(), np.uint8)
            image = cv2.imdecode(image, cv2.IMREAD_COLOR)
            images.append(image)
        return images

    def inference(self, images):
        """Perform inference on images."""
        return self.predictor(images)

    def postprocess(self, preds):
        """Serialize model preds."""
        rstrings = []
        for pred in preds:
            insts = pred['instances'].to('cpu')
            rdict = {
                'bboxes': insts.pred_boxes.tensor.numpy(),
                'labels': insts.pred_classes.numpy(),
                'scores': insts.full_scores.numpy(),
                'smasks': encode(insts.pred_masks.numpy().astype(np.uint8)),
                'featrs': insts.features.numpy()
            }
            rstrings.append(
                orjson.dumps(rdict, option=orjson.OPT_SERIALIZE_NUMPY)
            )
        return rstrings

    def handle(self, data, context):
        """Handle."""
        self.context = context
        metrics = self.context.metrics

        data = self.preprocess(data)
        tic = time.time()
        data = self.inference(data)
        toc = time.time()
        data = self.postprocess(data)

        metrics.add_time('InferenceTime', round((toc - tic) * 1000, 2))

        return data
Custom Config
model_store=data/store
inference_address=https://0.0.0.0:8443
management_address=https://0.0.0.0:8444
metrics_address=https://0.0.0.0:8445
private_key_file=certs/my.key
certificate_file=certs/my.pem
Issue Analytics
- State:

- Created 3 years ago
- Comments:9 (5 by maintainers)
 Top Results From Across the Web
Memory leak (unknown driver - 100% memory/disk usage)
It looks like it is a memory leak, so I installed Windows Kits and then used the poolmon.exe tool to find which processes...
Read more >My system scan results says "An active process has a possible ...
My system scan keeps telling me "An active process has a possible memory leak (Microsoft EdgeCP.exe)
Read more >Memory leak / Handle leak | Firefox Support Forum
Here is a fairly simple explanation for a memory leak: A Memory leak occurs when your computer closes an open program and that...
Read more >How to Fix Memory Leak in Windows 10 [Full Guides]
Your computer doesn't run so effectively anymore. This may be caused by memory leaks. Memory leak refers to the RAM memory loss in...
Read more >Solved: Re: Possible memory leak in Microsoft Mashup Evalu...
Possible memory leak in Microsoft Mashup Evaluation Container? 02-28-2017 10:58 AM. I am having an issue with the Microsoft Mashup Evaluation Container ...
Read more > Top Related Medium Post
No results found
 Top Related StackOverflow Question
No results found
 Troubleshoot Live Code
Lightrun enables developers to add logs, metrics and snapshots to live code - no restarts or redeploys required.
Start Free Top Related Reddit Thread
No results found
 Top Related Hackernoon Post
No results found
 Top Related Tweet
No results found
 Top Related Dev.to Post
No results found
 Top Related Hashnode Post
No results found
@harshbafna The reply https://github.com/pytorch/serve/issues/771#issuecomment-722461177 should be added to a FAQ. I learnt a lot about the design choices through this comment
As per the current framework, each model worker is a process and there is no possible way to share the model(s) across these processes. We are currently evaluating various options to optimize the memory usage of model workers. We are tracking this through #733.