
Lightrun Answers was designed to reduce the constant googling that comes with debugging 3rd party libraries. It collects links to all the places you might be looking at while hunting down a tough bug.
And, if you’re still stuck at the end, we’re happy to hop on a call to see how we can help out.
Add an option to highlight a subset of qubits in cirq.Heatmap
See original GitHub issueIs your feature request related to a use case or problem? Please describe.
Describe the solution you’d like
Heatmaps are often useful to visualize error metrics for qubits and couplers on the google devices. When selecting a subset of qubits to run an experiment on; it’s useful to consult heatmaps of error metrics. We should add an option to the cirq.Heatmap and cirq.TwoQubitInteractionHeatmap so that we can pass in a list of qubits and highlight it on the heatmap. For example:
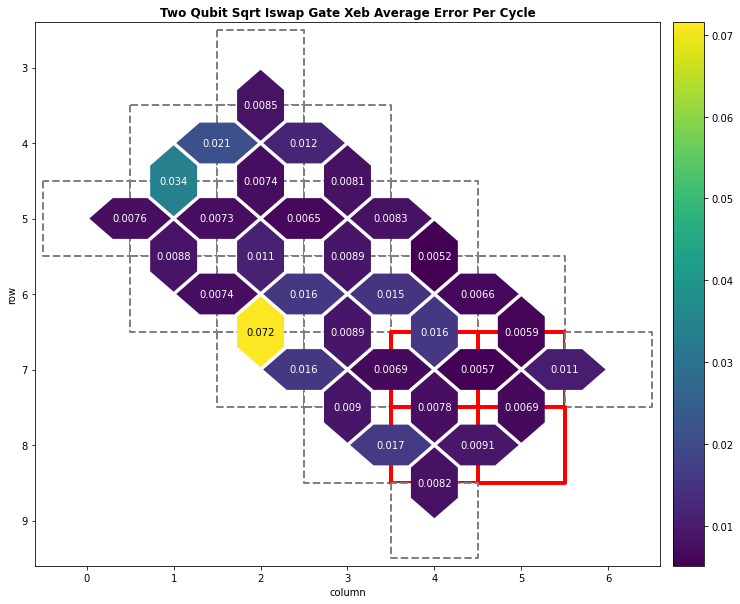
This can be done right now by manually specifying a different edge width and color for the selected qubits. For example:
fig, ax = plt.subplots(figsize=(12, 10))
edge_colors = tuple('red' if q in selected_qubits else 'grey' for q in device.qubits)
linestyle = tuple('solid' if q in selected_qubits else 'dashed' for q in device.qubits)
linewidths = tuple(4 if q in selected_qubits else 2 for q in device.qubits)
cirq.Heatmap({q: 0.0 for q in device.qubits}).plot(
    ax=ax,
    collection_options={
        'cmap': 'binary',
        'linewidths': linewidths,
        'edgecolors': edge_colors,
        'linestyles': linestyle,
    },
    plot_colorbar=False,
    annotation_format=None,
)
heatmap._plot_on_axis(ax)
fig.show()
What is the urgency from your perspective for this issue? Is it blocking important work? P1 - I need this no later than the next release (end of quarter)
Issue Analytics
- State:

- Created 2 years ago
- Comments:5
 Top Related StackOverflow Question
 Troubleshoot Live Code
 Top Related Reddit Thread
 Top Related Hackernoon Post
 Top Related Tweet
 Top Related Dev.to Post
 Top Related Hashnode Post
@kris524 Yes, the feature is still needed and we would appreciate help!
One last question: Could you suggest a method for
PolyCollectionor something that could help me get the data incollection_options? This is for testing purposes (I want to compare the expected vs returned contents oflinewidths edge_colors linestyle)