
Lightrun Answers was designed to reduce the constant googling that comes with debugging 3rd party libraries. It collects links to all the places you might be looking at while hunting down a tough bug.
And, if you’re still stuck at the end, we’re happy to hop on a call to see how we can help out.
Datadog tracer
See original GitHub issueDescribe the extension
The purpose of this extension is to provide native support to the Datadog tracer implementation for open tracing (using Datadog official dd-java-ot and dd-java-api jars)
What / who this extension is for
- people who are interested in migrating their java stack to Quarkus native, but cannot due to their dependence on Datadog for the tracing and the reasons mentioned here.
- people who do not want to move on open telemetry (yet)
- hopefully a temporary solution until Datadog provide full support for open telemetry’s features in their exporter (especially the metrics and logs)
- will support report of trace & span id in logs for correlation purpose
- will support all official configuration properties documented by datadog here, either from quarkus configuration and/or environment variables (environment variables override properties)
What / who this extension is not for
- a replacement to open telemetry as for the tracing part
- a long term solution
Interested in this extension, please +1 via the emoji/reaction feature of GitHub (top right).
Configuration suggestion
# default true, to activate/deactivate the extension at build time
quarkus.datadog.enabled=true/false
# default true, to activate/deactivate correlation through logs at runtime
quarkus.datadog.logs.injection=true/false
# all official datadog configuration properties, as string values
quarkus.datadog.xx.yy=zzz
Additional context
The extension is already developed, hosted on a private repository and used internally on different projects in production. I just want to share it to the community until Datadog offer a more complete support on open telemetry.
This extension should belongs to the Quarkiverse Hub if accepted
I’m of course interested in leading the development of this extension as it’s already done.
Issue Analytics
- State:

- Created 2 years ago
- Reactions:2
- Comments:17 (3 by maintainers)
 Top Related StackOverflow Question
 Troubleshoot Live Code
 Top Related Reddit Thread
 Top Related Hackernoon Post
 Top Related Tweet
 Top Related Dev.to Post
 Top Related Hashnode Post
@fiorenzino I invited you to a private repository so that you have access to the extension code.
Feel free to report any problem you have directly there.
Note: i’ve seen you’re interested in the log correlation. If in your application you are using the json logging extension, this one output the MDC context as a sub objected called ‘mdc’ in logs. So you’ll have to create a TraceId re-mapper rules in your datadog account where logs are shipped to so that datadog will use the trace_id / span_id from the mdc structure.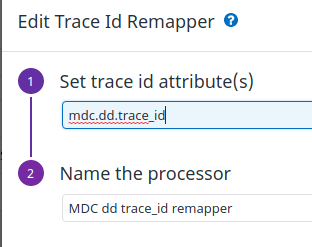
@fiorenzino Unfortunately right now, as explained in the first post, my extension is hosted on a private repository owned by my current company. The code also refers to the company names (artifacts, group id, package names) so i’m not going to share it.
I was thinking to wait for the repository to be available as it would automatically includes the correct names from the prepared structure, and then just rename my packages to fit quarkiverse instead of my company naming conventions.
I’ll try to find the time this week to migrate it in a personal repository so that you can access it without waiting for the official quarkiverse repo. Should not take long, just need to find the time 😃