
Lightrun Answers was designed to reduce the constant googling that comes with debugging 3rd party libraries. It collects links to all the places you might be looking at while hunting down a tough bug.
And, if you’re still stuck at the end, we’re happy to hop on a call to see how we can help out.
Data not displaying on public build but is displaying on local build
See original GitHub issueDetails
- Read the Docs project URL: geocat-examples.readthedocs.io
- Build URL (if applicable): https://geocat-examples.readthedocs.io/en/overlay11_issues/
- Read the Docs username (if applicable): michaelavs
Expected Result
When running make html locally via terminal, the build for Overlay_11a displays data via contourf on the map. As seen below:
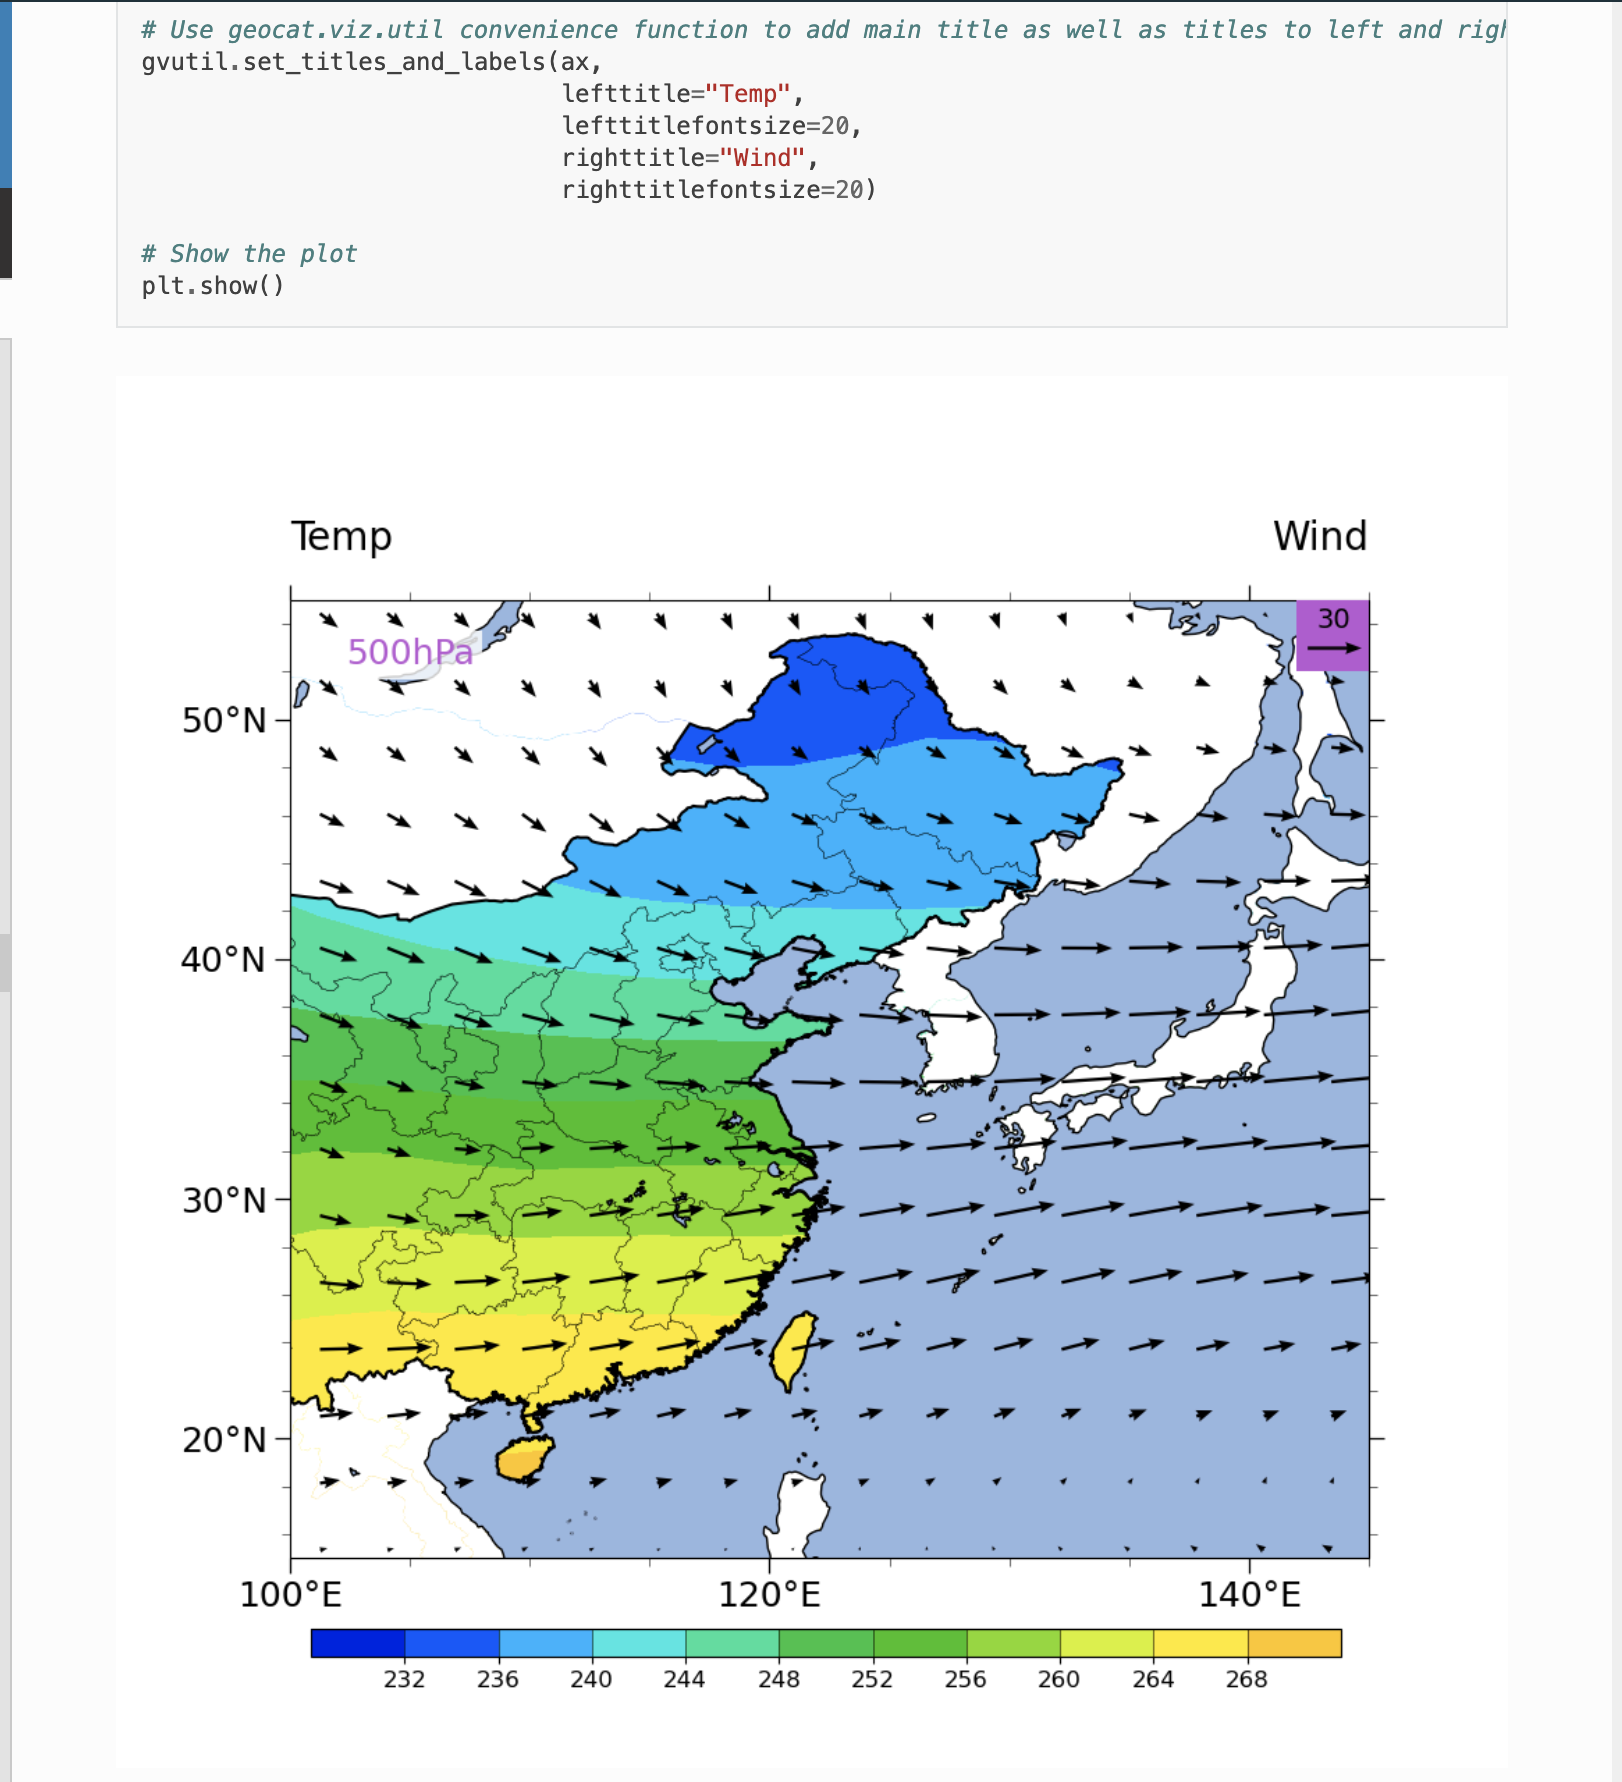
Which is the expected behavior
Actual Result
When this repo is built publicly/via RTD, the data disappears:
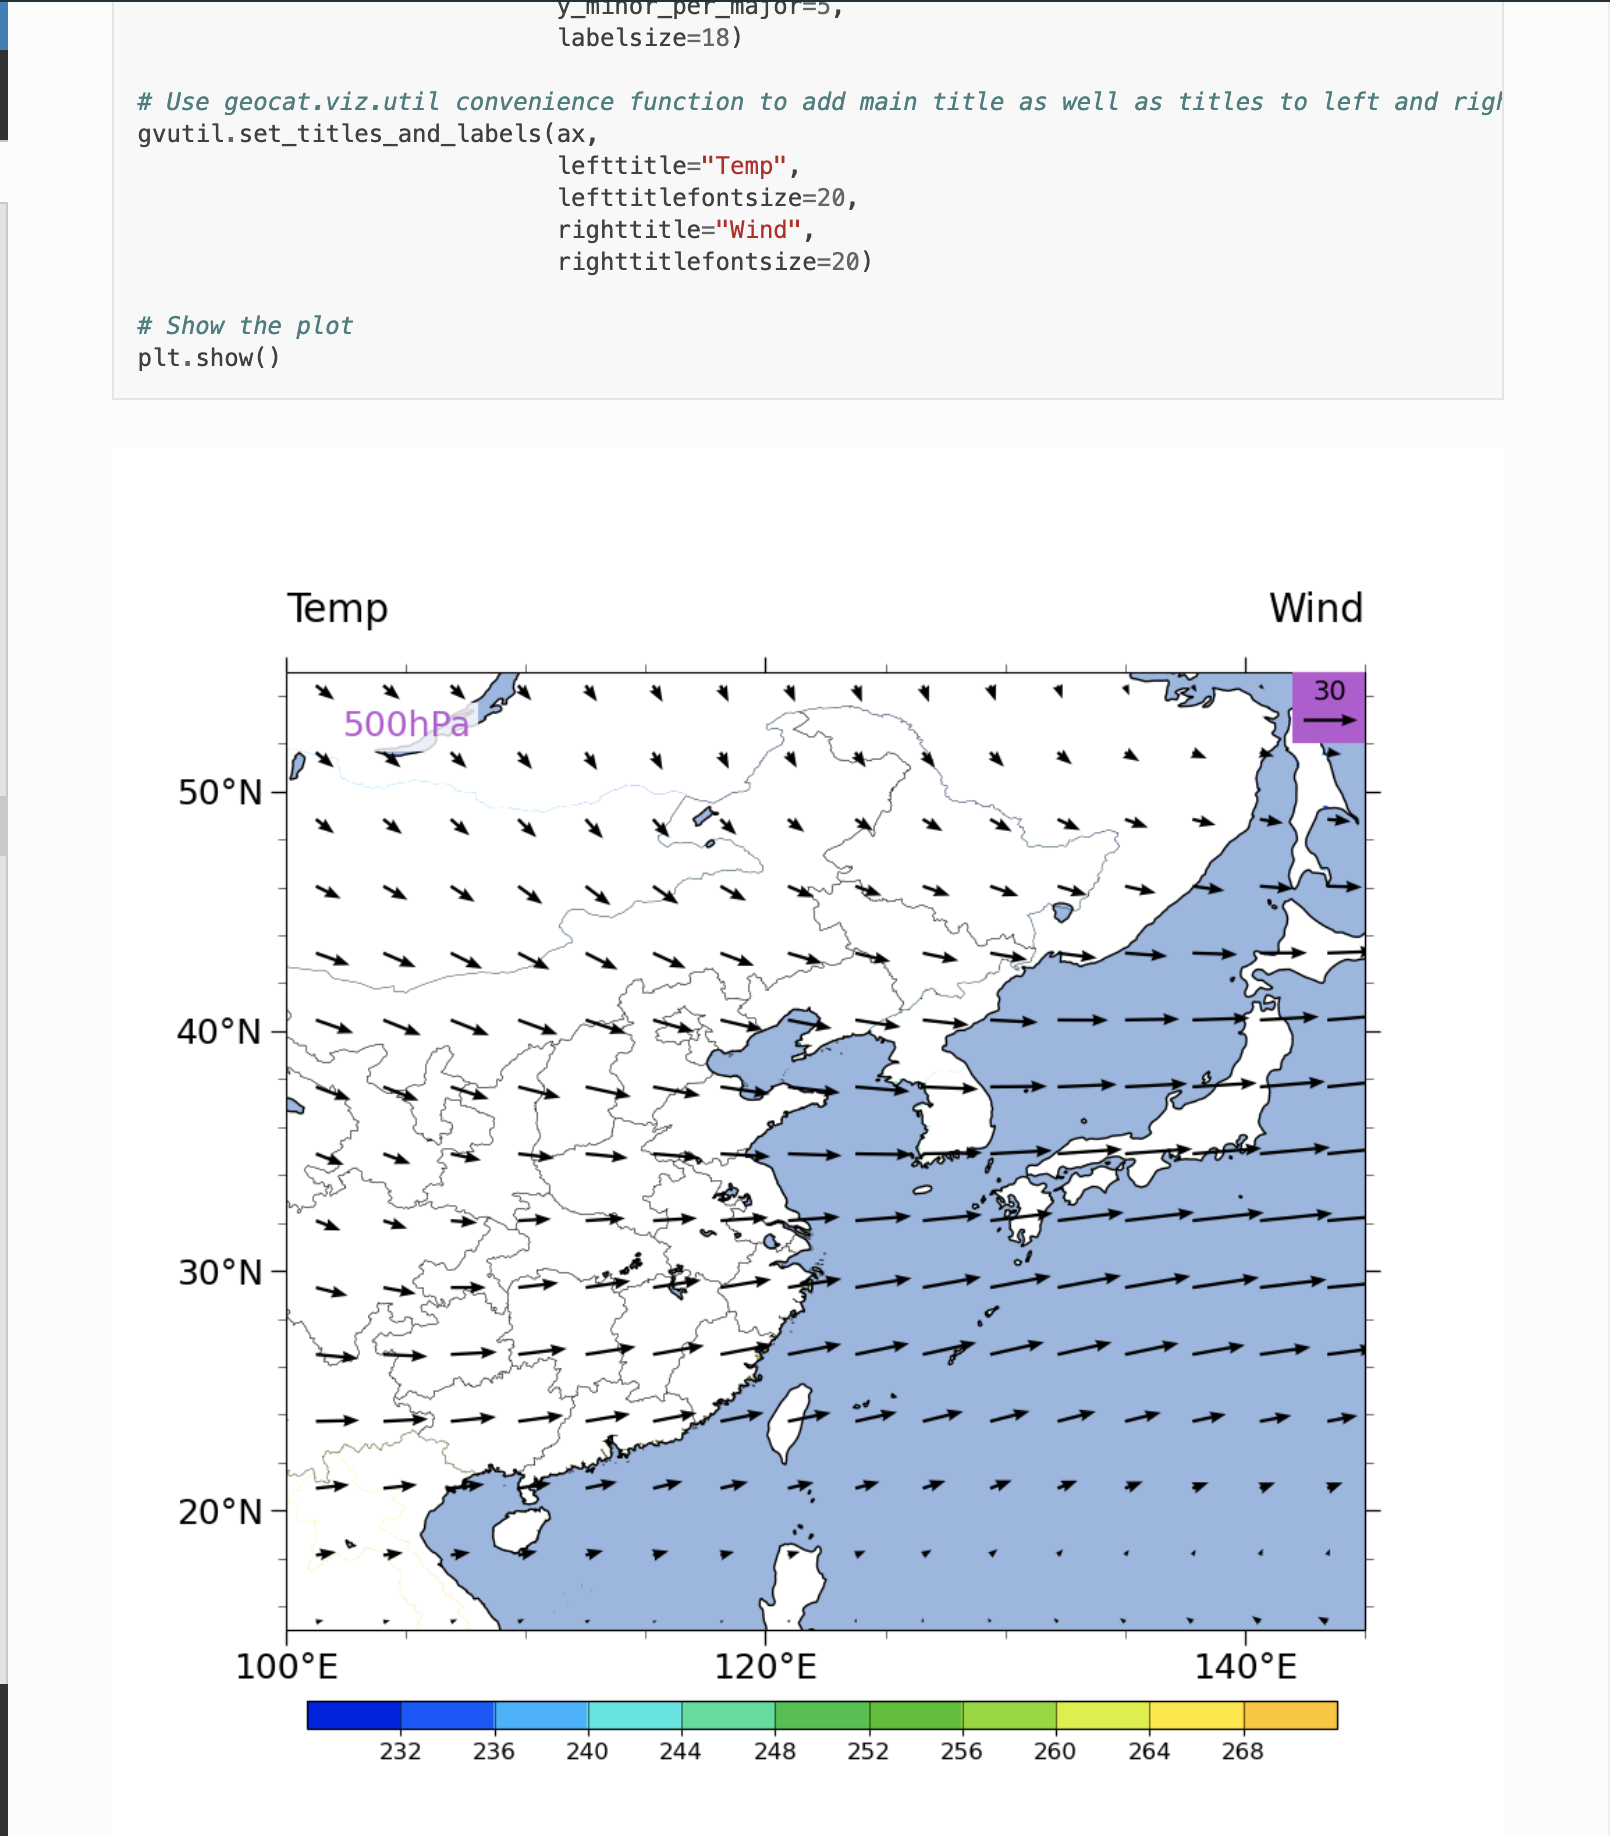
The environments are the same between the local and public versions of the builds. I have also tried editing the code to change the order that the data is plotted on the map and that did not resolve this issue. I’ve seen somewhat similar issues from a few years back, but their resolutions didn’t lead to a solution here.
Issue Analytics
- State:

- Created 2 years ago
- Comments:10 (5 by maintainers)
 Top Related StackOverflow Question
 Troubleshoot Live Code
 Top Related Reddit Thread
 Top Related Hackernoon Post
 Top Related Tweet
 Top Related Dev.to Post
 Top Related Hashnode Post
I tested this:
and I still got the empty plot. However, with this change:
I got the same plot I got here: https://github.com/readthedocs/readthedocs.org/issues/8519#issuecomment-924353362
😕
I suspect there is some caching behavior from sphinx-gallery that makes it more difficult to evaluate the changes locally, as well as Read the Docs own caching policies. That’s why I ran the script directly with
python Plots/Overlays/NCL_overlay_11a.py.In any case, I still can’t say that this is a Read the Docs issue.
@michaelavs I see that you’ve been doing some experiments on the branch lately. Can you point to a specific commit that should show the correct plot locally, but showed an empty plot on Read the Docs?
Locally, https://github.com/NCAR/GeoCAT-examples/commit/e410731d543d05e20b50586bce8fd2603f4a7664 shows the plot covered with data (also the sea), like the screenshot I shared yesterday, and https://github.com/NCAR/GeoCAT-examples/commit/39f446a1f023092caa205b144c74a4d754fbce29 shows the empty plot. Therefore, I can’t reproduce the “correct” plot locally (happy to follow this conversation on https://github.com/NCAR/GeoCAT-examples/pull/415).